Introduction In Hugging Face, a translation model is a pre-trained deep learning model that can be used for machine translation tasks, These models are pre-trained on large amounts of multilingual data and fine-tuned on translation-specific datasets. To use a translation model in Hugging Face, we typically load the model using the from_pretrained() function, which fetches […]
Analytics
Recap: Writer and Perficient Generative AI Event in NYC
In the past 12 months, Artificial Intelligence has gone from a future technology that has the potential to be revolutionary to a must have to remain competitive. From August 2022 to August 2023, “How to use AI” has skyrocketed on Google Trends by 507% with many leading innovators believing that this is the next internet […]
CPM Unwrapped: Achieving Operational Excellence Made Simple
Gaining operational excellence through Corporate Performance Management (CPM) involves a strategic approach to managing and optimizing various aspects of your organization’s performance. CPM encompasses processes, methodologies, and software tools that help align business activities with your goals, monitor performance, and make data-driven decisions. Here are some key pointers that will aid you in achieving operational […]
An Oracle Cloud Infrastructure (OCI) Data Lake Solution for Oracle Cloud ERP by Perficient
Oracle Cloud ERP offers several built-in reporting capabilities to address the needs for operational reporting. Implementing more elaborate reporting use cases though requires that we extract data out of Oracle Cloud ERP. This is in part because the real-time Fusion APIs are more tailored for transactional interfaces and therefore not adequate to scale to a […]
Part 2: Building the Source and Corresponding Mappings in Coveo Enterprise Search
Introduction Coveo Enterprise Search is a strong search solution that helps organizations enhance information management and offers users a hassle-free search experience. In order to accomplish this, Coveo establishes connections with numerous data and content sources, indexing the data to make it simple to find using its search interface. Two essential elements of this procedure […]
Part 1: Building the Source and Corresponding Mappings in Coveo Enterprise Search
Introduction Coveo Enterprise Search is a strong search solution that helps organizations enhance information management and offers users a hassle-free search experience. In order to accomplish this, Coveo establishes connections with numerous data and content sources, indexing the data to make it simple to find using its search interface. Two essential elements of this procedure […]
Revamping Data Integration for CRA Compliance: A Necessity in the New Normal
The Community Reinvestment Act (CRA) is a federal law in the US that promotes the interest of financial service firms to serve their communities’ credit needs, including low- and moderate-income neighborhoods. Federal banking agencies use the bank’s contribution metrics as a parameter when they apply for mergers, acquisitions, and new branch openings. CRA remains essential […]
My Very First JavaScript Code
“I can Talk JavaScript, I can walk JavaScript, I can Laugh JavaScript because JavaScript is a very Funny Language.” It’s really a fun writing JavaScript code in the beginning like you can show a pop-up alert, can set a condition to show results and you can also do mathematical calculations in the console. Just press […]
Getting Started with Coveo: A Comprehensive Overview for Tech Enthusiasts
Introduction: Welcome, to this comprehensive blog post about COVEO – a cutting-edge technology that is revolutionizing the way we search and access information. In this blog, we will delve into what COVEO is, its key features, benefits, and how it enhances the overall user experience. Whether you’re an IT professional, a developer, or simply curious […]
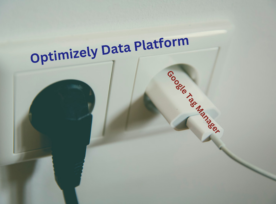
Integrate with Optimizely Data Platform using Google Tag Manager
The Optimizely Data Platform (ODP) and Google Tag Manager (GTM) are powerful tools for collecting and analyzing data. ODP provides insights into customer behavior, while GTM simplifies managing marketing tags without modifying website code. What is ODP: ODP allows businesses to collect, aggregate, and analyze data from various sources. It helps optimize marketing campaigns, enhance customer […]
AI Insights and Visuals in Power BI
AI Insights and Visuals AI has been evolving in many sectors of technology, and the same is being implemented in Power BI to a very good extent. In 2019, there were enhancements in Power BI where more powerful AI features were included, like AI visuals, Text analytics, the inclusion of Azure machine learning models, Image […]
Data + AI Summit is in Full Swing!
The worlds largest Data + AI conference is underway at the Moscone Center in San Francisco! Perficient experts have been immersing themselves in all the conference has to offer. Whether it was the opening keynote with Databricks CEO, Ali Ghodsi or learning about brand new releases from the Databricks platform in breakout sessions, our leaders […]


