Hello Trailblazers!
Salesforce provides users with a robust reporting toolset that enables businesses to analyze their data, identify trends, and drive smarter decision-making. Among the various types of reports available in Salesforce, Summary Reports stand out as one of the most popular due to their ability to group and summarize data effectively. Summary reports allow users to group rows of data and apply aggregate functions like sums, averages, and counts, making them ideal for tracking metrics across categories.
In this blog, we’ll cover what summary reports are, when and why to use them, and provide step-by-step instructions to create a summary report in Salesforce.
Before you Begin:
In the previous part of this blog, we covered the steps for creating a Tabular Report in Salesforce. Understanding the basics of creating tabular reports is essential. To learn more about it, please follow this link.
What is a Summary Report in Salesforce?
A Summary Report in Salesforce is a type of report that groups data rows based on one or more fields and allows you to perform aggregate calculations, such as sums, averages, and counts, on the grouped data. This makes summary reports particularly useful when you want to analyze data by categories, such as opportunities by sales stage, accounts by region, or cases by priority.
Key Features of Summary Reports:
- Group by Rows: Group records by one or more fields to organize your data.
- Aggregate Functions: Use functions like sum, average, min, max, and count to calculate metrics on the grouped data.
- Subtotals and Grand Totals: Display subtotals for each group and a grand total for all records.
- Charting Capabilities: Use summary reports as the data source for Salesforce dashboard components, such as bar charts, pie charts, or line graphs. (As we discussed already, these capabilities are not available in Tabular Reports. For more, see the previous part of this blog.)
- Conditional Highlighting: Apply conditional formatting to highlight certain values in the report.
When to Use a Summary Report?
Summary reports are perfect when you want to:
- Group Data: You need to group your data into categories like regions, sales stages, or account types.
- Summarize Data: You need subtotals and grand totals, such as total revenue by sales rep or total cases by priority.
- Use Charts: You want to display the report’s data visually in charts within Salesforce dashboards.
- Track Metrics: You want to monitor metrics across multiple categories and timeframes, like tracking lead conversion rates over time.
If you need a simple, flat list of records, you should consider using a Tabular Report instead.
Steps to Create a Summary Report in Salesforce
Let’s walk through the steps to create a summary report.
Step 1: Navigate to the Reports Tab
- Go to the App Launcher and search for Reports.
- Click Reports. This will navigate you to the Reports tab.
- In the Reports tab, select “New Report” located in the upper-right corner.
Step 2: Select a Report Type
When you click on New Report, Salesforce will prompt you to choose a Report Type. This determines the object(s) the report will pull data from.
- Select the object for your report. For example, if you’re creating report on opportunities, choose Opportunities – Standard report type.
- If needed, select a related object for your report, such as Opportunities with Products or Accounts with Contacts.
- Select the Opportunities Report type as shown in the figure below.

- Click Start Report.
Note: To learn more about creating Custom Report Types in Salesforce, please refer to this link.
Step 3: Define Report Filters
After selecting the report type, Salesforce will open the report builder. Here, you can define and customize the filters to narrow down the data according to your requirements.
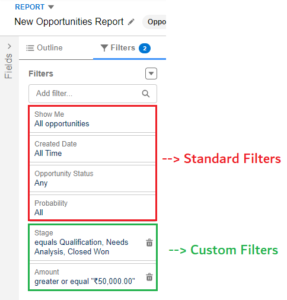
- Standard Filters: Salesforce will automatically apply some filters, such as the date range and object ownership (e.g., My Opportunities, All Opportunities). You can modify these filters based on your requirements.
- Custom Filters: Add any additional filters to refine your data further. For example, filter opportunities by Stage or Amount to focus on specific subsets of data.
Apply both the standard and custom filters as shown in the figure below.
Step 4: Add and Arrange Columns
Next, add the fields that you want to display as columns in your report and group them to create a summary report.
- In the left-hand pane, click Outline.
- In the Add Column search bar, type and select the fields you want to include in your report. For an opportunities report, you might add columns like Opportunity Name, Amount, Stage, and Close Date.
Step 5: Group Report’s Columns by Summary Field:
This is the important step when your tabular reports converts into the summary report.
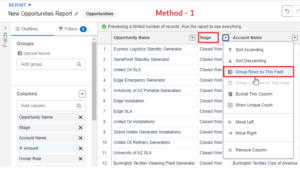
- Group Rows: To turn your report into a summary report, you need to group rows by a specific field. Click the down arrow on the desired column as shown in the figure below and select Group Rows by This Field.
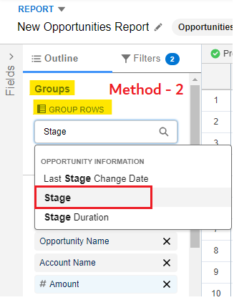
For example, group opportunities by Stage to see totals by sales stage. - You can also search for field in the “Add Group” search bar at Group Rows section as shown below.
- If needed, you can add additional groups by dragging and dropping more fields into the grouping section.
Step 6: Add Summarized Fields (Aggregate Functions)
Summary reports allow you to apply aggregate functions such as sum, min, max, average and median etc.
- In the report builder, click the drop-down arrow on a numeric field like Amount or Quantity.
- Select the summary type you want to apply, such as Sum, Average, Max, or Min.
- You can also add subtotals and a grand total to the report by enabling those options from the Options menu.
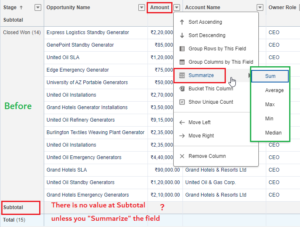
- For now, select “Sum”.
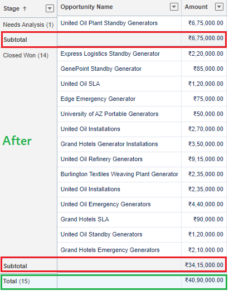
So, in this way, you can also use other aggregate functions too.
Step 7: Add a Chart (Optional)
If you want to visualize your data, you can add a chart to your summary report. This functionality is not available in the tabular reports.
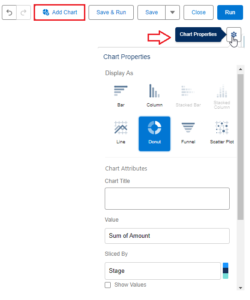
- Click Add Chart in the report builder.
- Choose a chart type that best represents your data, such as a bar chart, pie chart, or line graph. Here we are selecting “Donut”.
- Customize the chart by selecting the fields for the X and Y axes. (in case of Bar charts and Line Charts.)
- Click outside the chart properties.
- Click Save to save the chart to your report.
Step 8: Preview and Run the Report
At any point, you can preview the report to see how it looks.
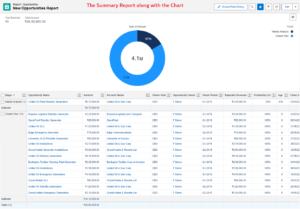
- Click Run to generate a preview of the report. Salesforce will display the report with real data based on the filters and groupings you have applied.
- Review the report for accuracy. If adjustments are needed, you can go back and modify filters, groupings, or summarizations.
The final report will look like this.
Step 9: Save and Share the Report
Once you’re satisfied with your summary report, you’ll want to save it so that others can access it.
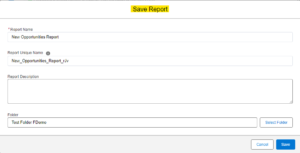
- Click Save & Run.
- Enter a report name, and optionally, provide a description to help other users understand the purpose of the report.
- Choose the folder where you’d like to save the report. You can save it to your personal folder, a public folder, or a custom folder based on your organization’s structure.
- Define the sharing settings to control access to the report.
You can also export the report. We already have discussed this in the tabular report blog. Please refer that blog for more details about how to export the report. The link is above and at the bottom of this blog post.
Example Use Cases for Summary Reports
Here are a few real-world examples of how you might use summary reports:
- Opportunities by Sales Stage: Group opportunities by stage and summarize the total amount in each stage to track the sales pipeline.
- Cases by Priority: Create a summary report to track the number of cases by priority and see how many high-priority cases are being resolved.
- Revenue by Region: Use a summary report to group accounts by region and calculate total revenue for each region.
- Tasks by Owner: Summarize tasks assigned to each team member to monitor productivity and workload distribution.
Benefits of Summary Reports
- Grouping Data: Summary reports allow you to group data by one or more fields, which provides valuable insights into performance across different categories.
- Subtotals and Grand Totals: By adding aggregate functions, you can quickly see key metrics like total revenue, average deal size, or the number of open cases.
- Visualization: With charting options, you can turn your summarized data into visual representations that make it easier to spot trends and make data-driven decisions.
- Flexible and Customizable: Summary reports can be filtered, grouped, and customized in various ways to fit the specific needs of your organization.
Limitations of Summary Reports
- Single Object Reporting: Summary reports are limited to a single report type. If you need to report on multiple objects, you might need a custom report type.
- Static Data: Unlike dynamic dashboards, the data in summary reports does not automatically update unless the report is re-run.
- Complex Calculations: While you can use simple aggregate functions, more complex calculations may require the use of formula fields or more advanced report types like matrix reports.
Conclusion
Summary reports in Salesforce are a powerful tool for analyzing and summarizing your data, allowing you to group records, apply aggregate functions, and visualize key metrics. Whether you’re tracking sales performance, monitoring support cases, or analyzing revenue by region, summary reports provide the flexibility and insights needed to make data-driven decisions.
By following the steps outlined in this guide, you can create custom summary reports very easily.
In the next part of this blog, we’ll learn about creating Matrix Reports in Salesforce.
Until then, Keep Reading !!
“Kindness is a bridge that turns ordinary days into meaningful memories.”
Related Posts:
You Can Also Read:
1. Introduction to the Salesforce Queues – Part 1
2.Mastering Salesforce Queues: A Step-by-Step Guide – Part 2
3.How to Assign Records to Salesforce Queue: A Complete Guide
4. An Introduction to Salesforce CPQ
5. Revolutionizing Customer Engagement: The Salesforce Einstein Chatbot

