Hello Trailblazers!
Salesforce offers a range of reporting formats to help businesses understand and analyze their data. Among these, Joined Reports stand out as one of the most powerful reporting tools. They allow users to combine and compare data across multiple report types and objects within a single report.
In this blog, we’ll explore what joined reports are and when to use them, and provide a step-by-step guide to creating and customizing a joined report in Salesforce.
Before you Begin:
In the earlier sections of this blog, we discussed the steps to create Tabular, Summary, and Matrix Reports in Salesforce. If you haven’t already, please review those sections using the provided links to ensure a better understanding.
What is a Joined Report in Salesforce?
A Joined Report in Salesforce is a report format that lets users add multiple report types, known as blocks, within a single report view. Each block represents a separate report and can pull data from different objects. This report type is ideal for displaying data from multiple sources side-by-side, allowing you to analyze relationships between different datasets effectively.
Key Features of Joined Reports:
- Multi-Object Data Comparison: Join data from multiple objects or related lists.
- Block-Based Structure: Add up to five blocks, each with unique filters and groupings.
- Customizable Filters: Apply filters to each block individually or use cross-block filters for global analysis.
- Dashboards Compatibility: Add joined reports to dashboards for a more interactive data experience.
When to Use a Joined Report
Joined reports are especially useful when:
- You want to compare data from multiple objects, like accounts and opportunities, in a single view.
- You need to analyze related data from different perspectives, such as comparing closed-won opportunities by region.
- You want to identify trends, such as comparing cases resolved with opportunities closed by product or account.
How to create a Joined Report in Salesforce
Let’s go through the steps to create a joined report that will allow you to analyze data from different objects in one view.
Step 1: Open the Reports Tab
- Go to the App Launcher and search Reports.
- Select Reports.
- Once in the Reports tab, click on New Report.
Step 2: Select the Report Type
- Choose the primary report type that will serve as the foundation for your joined report.
For example, here I’m selecting Opportunities because I want to start by viewing opportunity data.

- Click “Start Report” to open the report builder and start creating the report.
Step 3: Convert to a Joined Report Format
- In the report builder, locate the Format dropdown menu in the top-left corner as shown in the figure below.
- Select Joined Report from the format options. The report layout will change, allowing you to add blocks for each dataset you wish to compare.
- Click Apply.
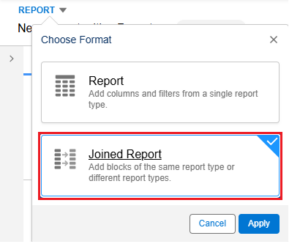
This step makes your normal report a Joined Report.
Step 4: Add Additional Report Blocks
- Click Add Block as shown below to add another dataset to your report. Each block you add can pull data from a different report type.
- Choose the report type for each additional block.
- Here for example we are adding a Cases block to view cases alongside opportunities.
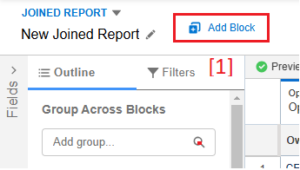

- Click on “Add Block” to include the desired report type in your report.
- Once you added the block to the report builder, your report will look as shown below.
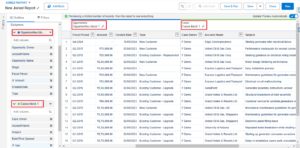
Note: Repeat this step to add up to five blocks, if needed, to cover multiple report types.
Step 5: Configure Block-Specific Filters
Each block has its own set of filters, allowing for individualized data filtering.
- Click Filters within each block to adjust its dataset/records.
- Apply relevant filters to narrow down the data displayed in each block as per your requirements. For example, you could filter opportunities by a specific Stage and cases by Status as shown in the figure below.
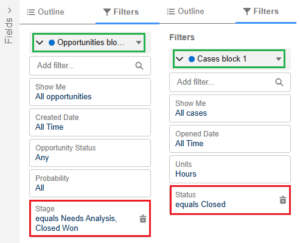
Note: These filters operate independently, allowing you to create precise, context-specific views within each block.
Step 6: Add Columns to Each Block
Add fields to each block to customize the data displayed:
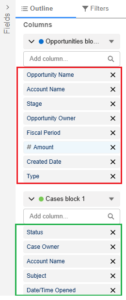
- In the Outline panel, click Add Column within each block to add the fields you want to display, such as Amount for opportunities or Case Status for cases.
- You can also use drag-and-drop functionality to arrange columns as needed.
- Customize each block’s columns to highlight the unique data points that matter most for your analysis.
Step 7: Group Data within Each Block
Grouping in the Salesforce Reports makes the reports structured and easy to summarize.
- Go to the Outline Panel: In the Group Block section, type Account Name and select it to create a grouping.
- Group Across Blocks: This action will group records across multiple blocks, such as Opportunity and Case blocks.
- As shown in the image above in Step 6, Account Name serves as a common field for both blocks, enabling seamless alignment of related Opportunities and Cases for each Account.
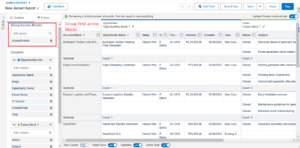
So joined reports help to scan the data faster across the blocks.
Step 8: Add Summaries to Each Block
Summaries allow you to calculate aggregate metrics, such as sums or averages.
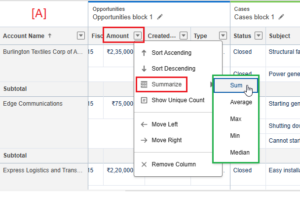
- Click on a numeric column, such as Amount, within each block and choose a summary function (e.g., Sum, Average, Min, Max).
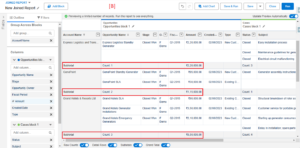
- Summaries will display totals or averages at the bottom of each grouping level as shown in the figure below.
- These summaries can provide useful insights into total sales, case resolution counts, or other key metrics across the blocks. Please refer to the below image.
Step 9: Preview and Fine-Tune the Report
Click Run to preview your joined report and ensure it meets your analysis needs. At this stage, review the data, groupings, and summaries to make sure the report layout is aligned with your goals.
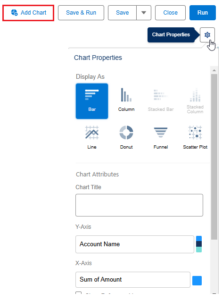
Step 10: Add a Chart (Optional)
Charts can enhance the visual impact of your joined report by summarizing data visually:
- Click Add Chart at the top of the report builder.
- Click “gear icon” – Chart Properties.
- Select the chart type (e.g., bar, pie) that best matches your data. Here we are selecting “Bar Chart”
- Configure the chart options to reflect the desired visuals for the report.
- Click Save.
Step 11: Save and Share the Report
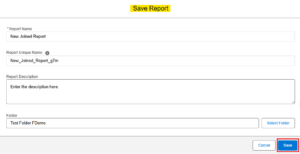
When your report is ready, save it for easy access and sharing.
- Click Save & Run to save the report.
- Name your report and add a description if needed.
- Choose a folder to save it in, selecting either a public or private folder based on access needs.
Example Use Cases for Joined Reports
Here are some common scenarios where joined reports can be especially helpful:
- Sales Performance by Region and Product: Compare sales opportunities across different regions and products.
- Customer Support Analysis: View open cases, resolved cases, and case priority for each account and more.
Benefits of Joined Reports
- Holistic Data Analysis: View and analyze data across multiple objects in one report.
- Flexible Filtering: Apply filters and cross-block filters for precise data views.
- Multi-Dimensional Summaries: Summarize data independently within each block for powerful insights.
Limitations of Joined Reports
- Report Limits: Joined reports support up to five blocks, which may be restrictive for larger datasets.
- Performance: Loading times may be slower for joined reports containing large datasets.
- Formatting Complexity: Joined reports are more complex to set up and may require advanced Salesforce reporting skills.
Conclusion
Joined reports in Salesforce offer a unique and powerful way to combine data from multiple sources, enabling users to create detailed, comparative insights within a single report. By using the blocks we studied above, you can break down information across various report types and display it side by side for enhanced data analysis.
With this step-by-step guide, you can create joined reports that provide multi-dimensional insights for the report’s data.
Happy Reading !!
“True growth comes not from what you achieve, but from the challenges you overcome and the lessons you carry forward.”
Related Posts:
You Can Also Read:
1. Introduction to the Salesforce Queues – Part 1
2.Mastering Salesforce Queues: A Step-by-Step Guide – Part 2
3.How to Assign Records to Salesforce Queue: A Complete Guide
4. An Introduction to Salesforce CPQ
5. Revolutionizing Customer Engagement: The Salesforce Einstein Chatbot

