
What a great week at Connections 2024 in Chicago! There were so many great sessions and announcements to be excited about. I wanted to write about two of the lesser known, but albeit very important features of Data Cloud and how they work together: Data Graphs and Query Editor!
In the fast-paced world of customer relationship management (CRM), Salesforce Data Cloud stands out as a robust platform that empowers businesses to harness the full potential of their data. Among its many powerful features, Data Graphs and the Query Editor are essential tools that enable users to manage, analyze, and derive insights from their data seamlessly. In this blog post, we’ll explore these features in detail, uncovering how they can transform your data strategy and drive business success.
Understanding Data Graphs in Salesforce Data Cloud
Data Graphs in Salesforce Data Cloud offer a sophisticated way to visualize and manage complex data relationships. Unlike traditional tabular data models, data graphs represent information as interconnected nodes and edges, which can provide a more intuitive understanding of how different data points relate to one another.
Key Benefits of Data Graphs
- Enhanced Data Relationships: By using a graph-based approach, Salesforce Data Cloud allows users to see connections between various data entities. This is particularly useful for understanding customer journeys, product interactions, and other multi-dimensional data scenarios.
- Improved Data Quality: Data graphs help in identifying inconsistencies and anomalies by highlighting unexpected relationships or gaps in data. This ensures higher data quality and reliability for decision-making.
- AI Needs – Prompt Builder: As an organization starts to leverage Prompt Builder, Data Graphs will be a helpful way to allows users to ground their prompts with data from Data Cloud. This SF Ben article about Data Graphs shows how a Data Graph will show up in Prompt Builder.
The Power of Query Editor in Salesforce Data Cloud
Think of the Query Editor as the ‘Data Explorer’ from Data Cloud on steroids. It is simply so flexible and intuitive to use for exploring your data in Data Cloud.

The Query Editor is another powerful tool within Salesforce Data Cloud, designed to simplify the process of querying and analyzing data. It offers an intuitive interface that allows users to write, test, and execute queries without needing deep technical expertise.
Key Features of Query Editor
- User-friendly Interface: The Query Editor provides a visually appealing and easy-to-navigate interface, making it accessible to users of all skill levels. This democratizes data access across the organization, enabling more team members to derive insights from data.
- Robust Query Capabilities: Whether you’re performing simple data retrievals or complex joins and aggregations, the Query Editor supports a wide range of SQL-like query capabilities. This flexibility allows users to tailor their data analysis to specific business needs.
- Real-time Data Access: The Query Editor enables real-time querying of data stored in Salesforce Data Cloud, ensuring that users always have access to the most current and relevant information. This is crucial for being able to understand and test the data that has been ingested into and segmented within Data Cloud.
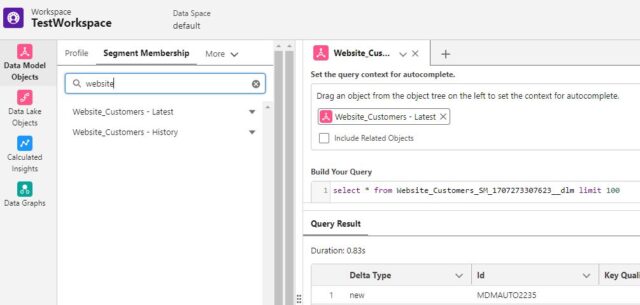
- Seeing all forms of Data: Being able to easily get to all forms of data within one single tool is very flexible. Users can get to data in 1) Data Models objects 2) Data Lake objects 3) Calculated Insights and 4) Data Graphs with the same user interface and functionality.
Combining Data Graphs and Query Editor for Maximum Impact
When used together, Data Graphs and the Query Editor offer a powerful combination that can transform how businesses manage and utilize their data. Here are a few ways they can be leveraged together:
- Advanced Data Analysis: Use Data Graphs to identify complex relationships and then drill down into specific details using the Query Editor. This layered approach provides both high-level insights and granular data analysis. Notice the green ‘Data Graphs’ icon on the left in the image above within the Query Editor.
- Personalized Customer Experiences: By understanding customer behavior through Data Graphs and querying specific customer data with the Query Editor, businesses can create highly personalized experiences that drive loyalty and satisfaction.
Conclusion
Salesforce Data Cloud’s Data Graphs and Query Editor are indispensable tools for modern data management and analysis. By leveraging these features, businesses can unlock deeper insights, enhance data quality, and drive more informed decisions. Whether you’re looking to improve customer experiences, optimize operations, or gain a competitive edge, these tools provide the foundation you need to succeed in today’s data-driven world.
Safe travels back from Connections 2024!
For some more reading related to the ‘Zero Copy Partner Network‘ announcement at Connections 2024, please read about the benefits of those Zero Copy features in this recent blog post.


Wow, this was an eye-opening read! Exploring the potential of Salesforce Data Cloud and delving into data graphs and query editor functionalities has expanded my understanding of harnessing data for strategic insights. Your clear explanation makes complex concepts accessible, and I’m eager to apply these insights to optimize our data management processes. Thanks for sharing this valuable knowledge!