
In this blog, we will show a GIF as a report page tooltip when hovering over a visual.
This cool technique allows you to display instructional GIFs or videos for our end users.
Steps for Creating GIFs:
- App to record gifs
- Adding gifs to Power BI
- Adding Tooltip
- Integrating with button
App to Record GIFs:
There are many tools in the market used for creating GIFs, but here in my project, I used the Screentogif tool.
This tool is very easy to use; you need to follow some steps to install it:
- Go to the website screentogif.com to install Screentogif.
- Once the tool is installed, we need to record the action for the GIF.
- For this, we need to open the Power BI report and, over it open Screentogif.
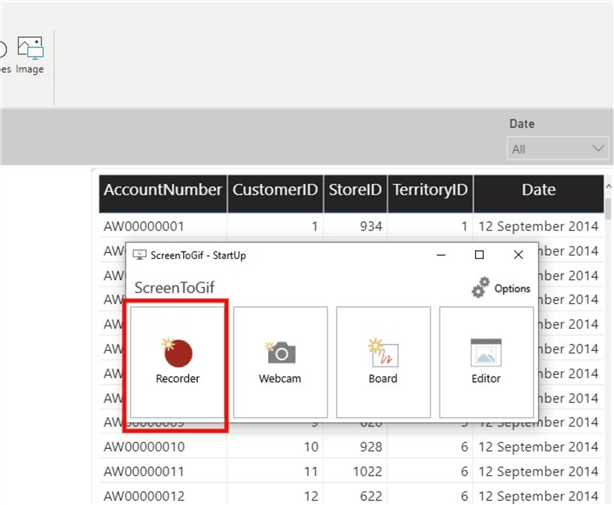
- Click on “Recorder” and adjust the screen size of the Screentogif recorder as needed. Click on “Record,” as seen in the diagram below.
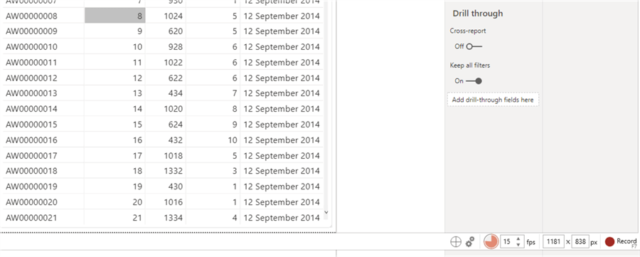
- Start the recording, and we can see the timer on the screen( on the right side bottom). Whatever action you need can be performed, and once done, you can stop the timer.
- It will automatically take us to the editing page, where we can make basic changes like edits and save the recordings.
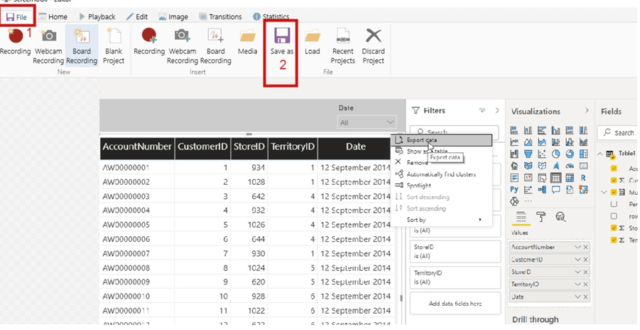
- Now you can save the gif to the proper location
Hence, a GIF is created.

Adding GIFs to Power BI:
We need to bring recorded GIFs to Power BI.
As we are using Tooltip here, first, we need to create a new tooltip page where we can place the GIF.
Open the new page tab and follow the steps:
- Go to the “Format” settings and expand the canvas background section.
- Click on the “Add image” to bring in the GIF we created and saved earlier.
- Change the page size to custom or the size you want, based on the GIF size.
- Go to page information and turn on Tooltip. Then, reduce the transparency to zero from 100 and change the “Image Fit” to “Fill,” as seen in the diagram below.
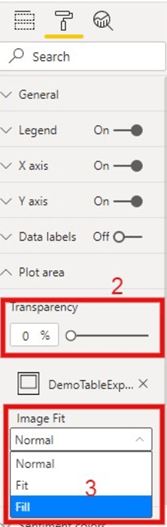
Now you will be able to see the GIF on a new page.
Adding Tooltip:
- Come to page 1; here, we need to set up a button so that when we hover over it, it will show us the GIF.
- We can just insert a Help (question mark) button, go to insert menu<<Buttons<< Help.
(We can use any button as per your understanding)
- Insert a card visual over the image of the button and create a TOOLTIP measure
- Tooltip measure = “ “
(Note: Here, we are using just the blank space in measure, the reason is we need to see only the button and not the card visual)
- Drag the measure into the card, which is placed over the button, and go to format, turn on the tooltip, and select page2 (tooltip page)
- Now the last thing we need to do is turn off the background of the card visual; we will be able to see only the button and not the card.
Hence, we can see the Instructional GIF when we hover over the button.
In this blog, we learned how to show report-level tooltips over any visual; we can create very cool instructional GIFs to guide the user to navigate the report.