
Hello Trailblazers!
Salesforce Reports are powerful tools that enable users to organize, analyze, and display data in a structured manner. Reports in Salesforce provide actionable insights, allowing businesses to track performance, monitor key metrics, and make data-driven decisions. They serve as the foundation for understanding customer behavior, sales trends, and operational efficiency.
In this blog, we will explore the concept of Salesforce Report, their types, and how to use them effectively in your organization.
What Are Salesforce Reports?
A Salesforce Report is a list of records that meet the criteria you define. It displays data in a format that allows users to filter, group, and summarize data for analysis. Reports are essential for tracking and visualizing data across objects such as Accounts, Opportunities, Leads, or custom objects.
Note: To generate a customized report across two or more objects, you will need a “Custom Report Type.” If you’d like to learn how to create Custom Report Type for reports, please follow this link for a step-by-step guide.
Types of Salesforce Reports
Salesforce offers four primary types of report, each with unique capabilities and use cases. Let’s dive into the details of each:
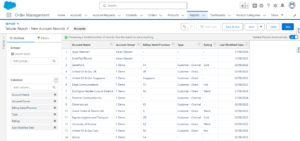
1. Tabular Reports
Tabular Reports are the simplest type of Salesforce report. They provide a straightforward, row-based format, similar to a spreadsheet, and display an ordered set of fields in columns. Tabular reports are ideal for tasks like creating lists, such as contacts, leads, opportunities, accounts lists, or simple data export.
Limitations:
- You cannot create charts from tabular report.
- Tabular report are not suitable for complex data analysis, as they lack groupings or summaries.

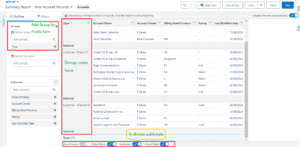
2. Summary Reports
Summary Report allow you to group rows of data, summarize the information, and apply filters and charts. This type of report is more powerful than tabular report as it lets you group by field and display subtotals and totals for numeric data.
Key Features:
- Data can be grouped by rows.
- You can add subtotals, grand totals, and charts.
- Filters can be applied to highlight specific data points.
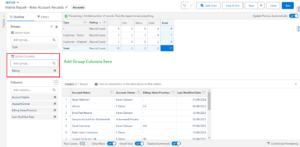
3. Matrix Reports
Matrix Reports are a more advanced version of summary reports. They allow you to group and summarize data in both rows and columns, creating a two-dimensional analysis. Matrix report are ideal for tracking performance across multiple dimensions, such as by product and region.
Key Features:
- Data can be grouped by both rows and columns.
- Supports subtotals, grand totals, and charts.
- Provides a comprehensive view of performance across multiple variables.
4. Joined Reports
Joined Reports allow you to combine data from multiple report types or objects into a single view. This type of report is especially useful when you want to analyze data from different objects or datasets side by side.
Key Features:
- Allows multiple report blocks for each dataset.
- Combines data from different objects into a single report.
- Great for complex reporting and analysis across several data sources.
So these are the basics of the Salesforce report and its types.
Conclusion
Salesforce Report are a critical feature that helps organizations track performance, analyze data, and make informed decisions. With four main types of report—Tabular, Summary, Matrix, and Joined—Salesforce offers flexibility in how you can visualize and analyze your data. By understanding the different types of reports and their use cases, you can leverage the full power of Salesforce reporting to meet your organization’s needs.
Happy Reading !!
The journey of learning never ends; every moment is a chance to grow.
Related Posts:
You Can Also Read:
1.A Comprehensive Guide to Custom Report Type in Salesforce
2.Mastering Salesforce Queues: A Step-by-Step Guide – Part 2
3.How to Assign Records to Salesforce Queue: A Complete Guide
4. An Introduction to Salesforce CPQ
5. Revolutionizing Customer Engagement: The Salesforce Einstein Chatbot