Welcome to my series on Sitecore Website Performance. This series will outline the key metrics and tools used to track website performance as well as specific recommendations to improve page speed within Sitecore. In Part 1 we will review how to test website performance and how we get the most accurate results.
What is the best tool to test the performance of my website?
When searching for the best website performance tools it can be difficult to know which is better. Most tools have standardized using Google’s Lighthouse algorithm in addition to their own metrics that they view as important. The tool that you pick should be using the latest standard algorithm in performance which currently is Google Lighthouse.
The top page speed tools we have used include:


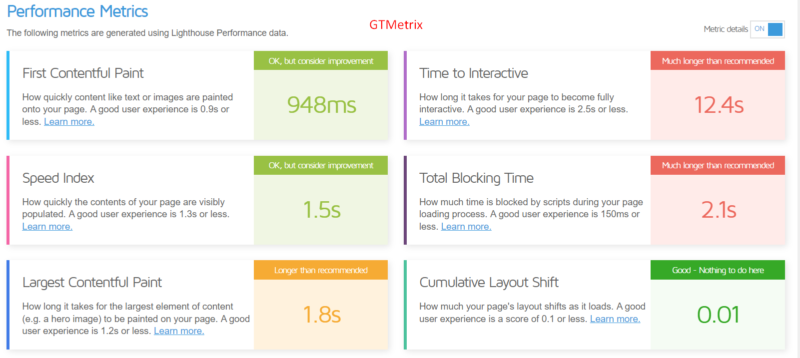
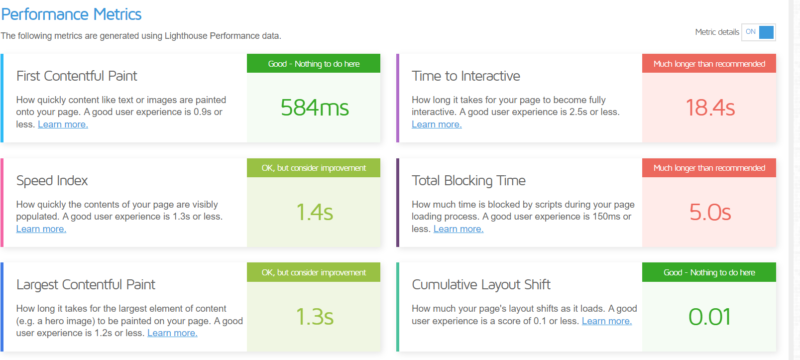
The examples above test the same URL from each of those top page speed tools. We can see that some of the same metrics are used but have different results. Instead of only running one test and using different tools, we need to find a way to get accurate page speed metrics.
How to get the most accurate results from your page speed tests
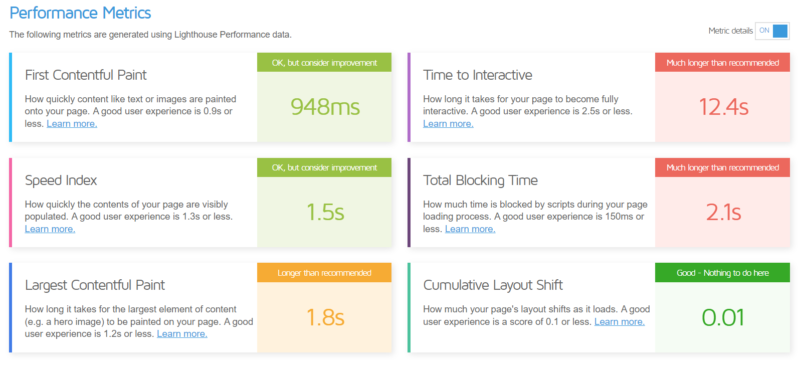
When testing from any of these tools you may have noticed that when you run the test using the same URL, same tool, and re-run the test multiple times you will see slightly different results.
Test1:

Test2:

Test3:

One of the biggest issues with performance and page speed tests is that the test being run is only a point in time. During that point in time there could be slightly higher load on the servers, a publish to the website, deployments, or just standard latency from the testing server. All of these contribute to slightly different results when running the test.
To get the most accurate results the tool should allow you to do the following
- Automatically run the page speed test multiple times within a day

- Track a history of core metrics so that an average of those values can be calculated


- Identify specific examples of improvement on a captured performance metric

Running any of the tools once can help with identifying a general idea of metrics and improvements. To get accurate metric results the final values must be an average of multiple tests run over a week or more. Our Sitecore Managed Services department captures an average of 2 weeks and an average over the past month. Then we will track, document, and review with our clients if those average values are trending better or worse. We test the average performance using the same tool, same conditions, and the same page to confidently determine how the website performance is trending each month. If there are any specific metrics that trend worse we will dive into what improvements we can make that will have the biggest impact on page speed.
When selecting a page speed tool, confirm the following
- Once a tool is selected, continue to use that tool so that you can first get a baseline for the performance metrics and then use additional tests to identify if the website is trending better or worse using the same metrics and algorithm.
- The tool needs to have some process or method that allows automated testing multiple times within a day and can record those historical values.
- Confirm if the tool has a process to take the average of those metrics over 2 weeks or more. If the tool does not already have that functionality, you should create a process to record and calculate those averages.
- The tool should be able to help provide specific examples from the website to explain a certain metric grade and how that metric can be improved.
Start by testing the homepage of the site
The homepage is the first page we will test when performing page speed tests. It is important to note that the results of the home page do not represent the performance of the entire site. However, the homepage is a critical page and a good indicator of how the overall site is performing. We use the home page as our main page to test because any global elements on the site will be included in the home page, and the home page will usually have the highest traffic. Also, the home page usually has the least number of changes and most of the changes done are global to the website. If there are any other critical pages that get high amounts of traffic or are critical to the business, those pages should be tested separately.
Plan, monitor, and document the results
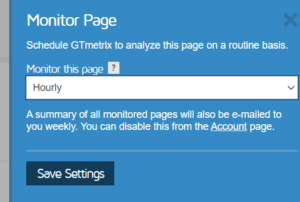
After selecting a page speed tool the next steps are to plan the frequency of automated tests being run, decide on any additional pages that need to be tested, and document the averages of the metric values over time. Monitor the pages as frequently as possible within a day and over time before calculating the averages. For GTMetrix we will monitor every hour and then take an average of those values after 2 weeks and after a month. When taking the averages of the metrics we will also remove any major outliers that could be due to deployments or publishes. Last, we document the results so that we can easily compare to the last month average and determine if performance is trending better, worse, or the same.
In Part 2 we will take a look at analyzing the report details and which specific metrics to focus on.


Great article, Sean! Can’t wait to see the other parts as they come out.