
What is Drill Down in Power BI?
In Power BI, Drill Down is nothing but the next level of hierarchical insights of the data. For example, when you want to see a year-wise sales summary, you may want to look into the “Monthly” summary, “Quarterly Summary,” and day-wise summary. So, this is where the drill-down option we will use in Power BI.
Drilling down is essential because, in a yearly revenue chart, you may see overall sales. Still, there are chances where most of the revenue is generated in a single quarter or few months itself, so drilling down the general view of the summary to a deeper level.
How to Use Drill Down Option in Power BI?
Follow the below steps to use the Drill Down option in Power BI.
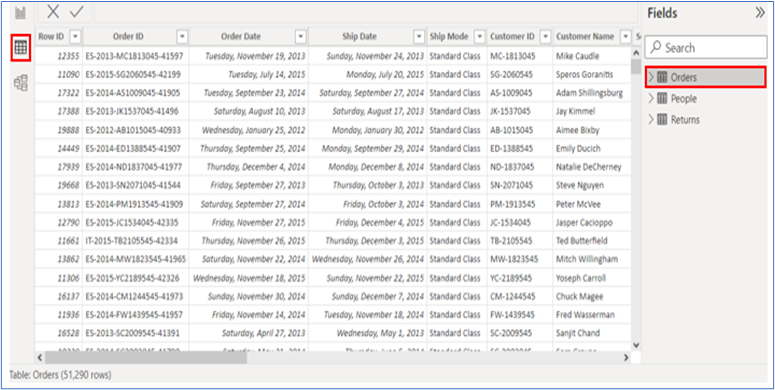
- We are going to use the Sales data, but you can use any other data for practice along with us.
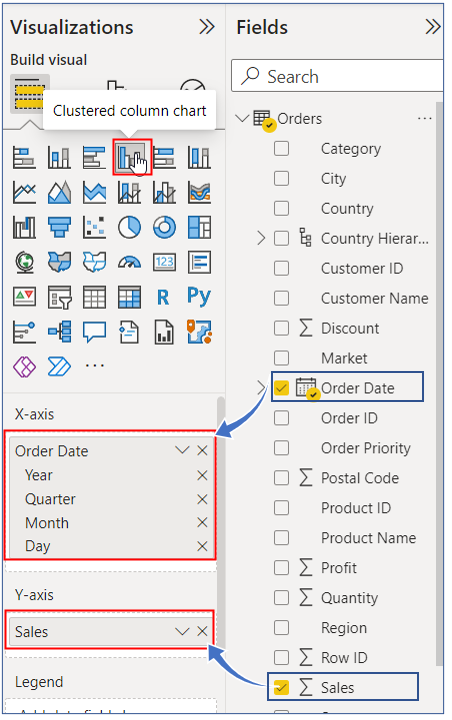
- We create a clustered column chart to view the yearly sales summary for this drag and drop the “Order Date” column to the “X-axis” and the “Sales” column to the “Y-axis.”
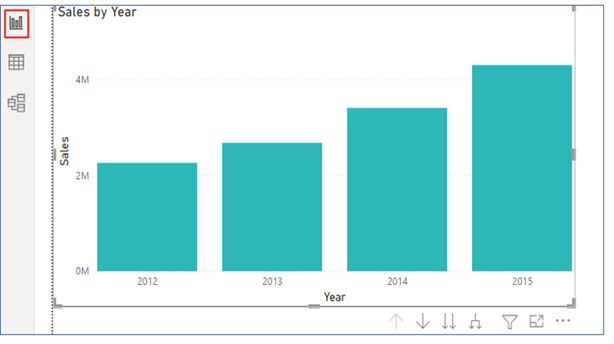
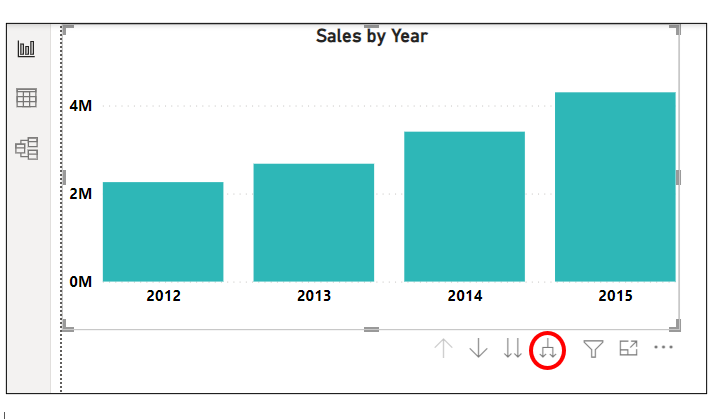
- This has created a yearly column chart.
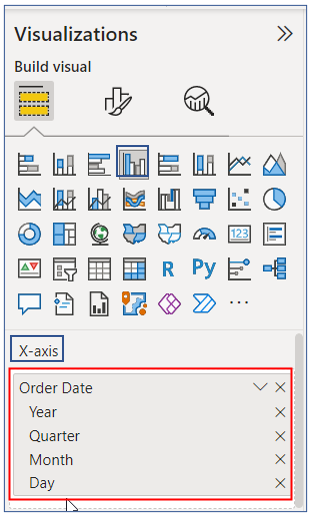
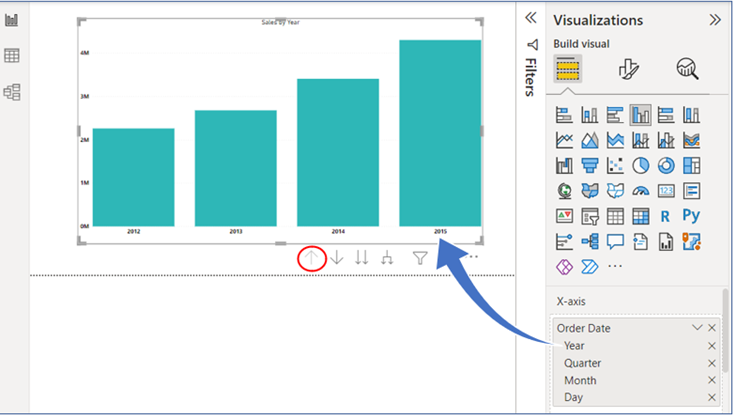
- Under the “X-axis,” when we drag and drop the “Order Date” column, we can see it has created a hierarchy of dates as “Year, Quarter, Month, and Day.”
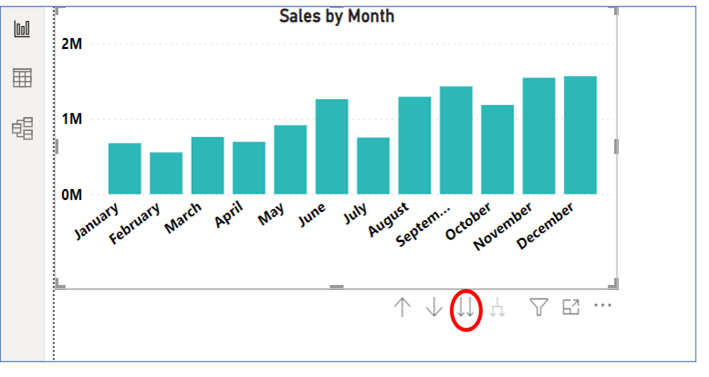
- Whenever there is a hierarchy, we can make use of the “Drill Down & Drill Up” options. Looking closely at the bottom of the chart, we can see some arrow keys.
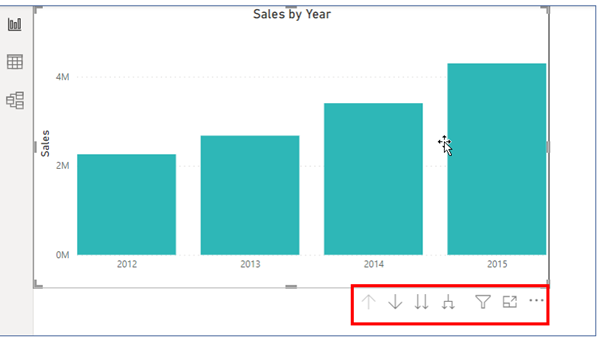
The first is “Up Arrow,” the second is “Down Arrow,” the third one is “Double Down Arrow,” and another one-off “Expand” options.
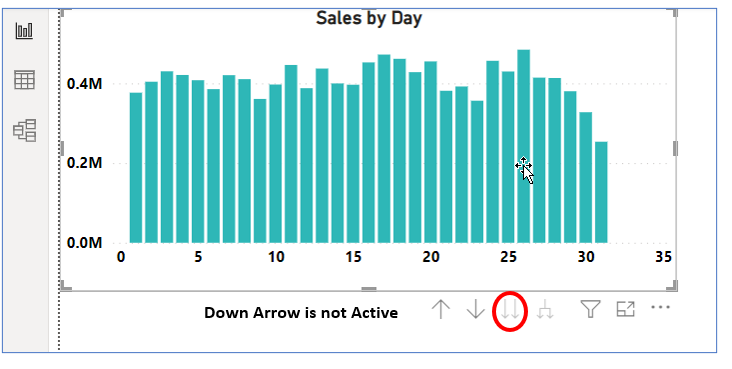
6. As of now, “Up Arrow” is not active because in the hierarchy of order and date first option is “Year,” and the chart is showing the “Year” summary only, so we cannot go any further up.
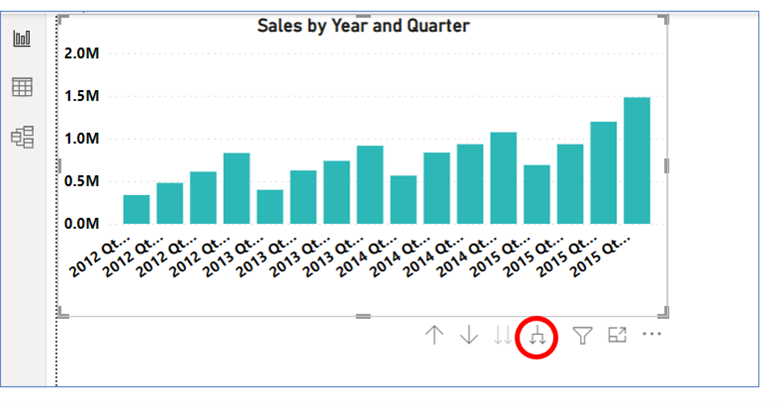
7. The next option below the “Year” is “Quarter,” so now if you click on “Double Down Arrow,” it will show “Quarterly-wise.”
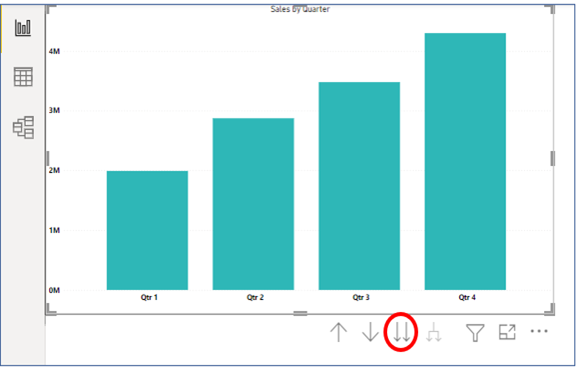

8. You can see above we have clicked once on the “Double Down Arrow,” and it has taken deeper into the next level, i.e., the “Quarterly- wise” chart and “Up Arrow” is active now since we have moved one level down or one hierarchy down now, we can go up.
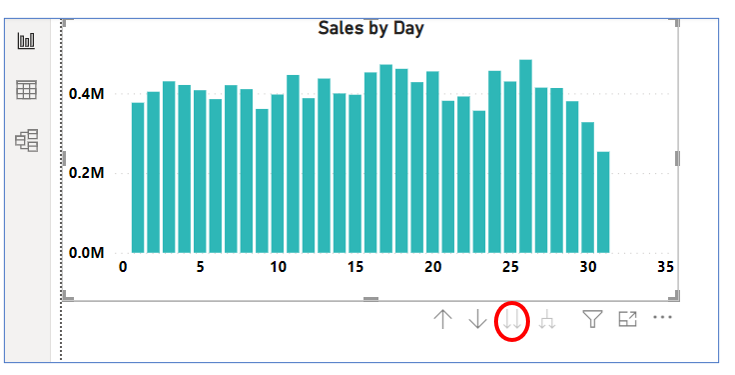
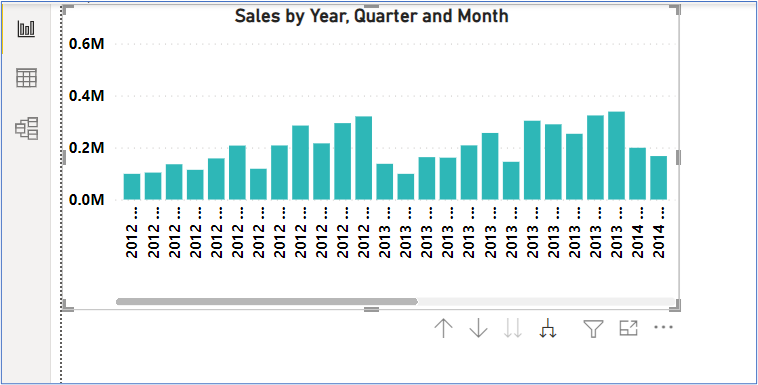
9. Similarly, when you click on this “Double Down Arrow,” it will move one more level further and shows a monthly summary.
10. Now, it is showing a monthly summary. Similarly, when you click “Double Down Arrow” one more time, it will take you to the last hierarchy level, i.e., “Days.”
11. After reaching the last hierarchy level, we no longer drill down.
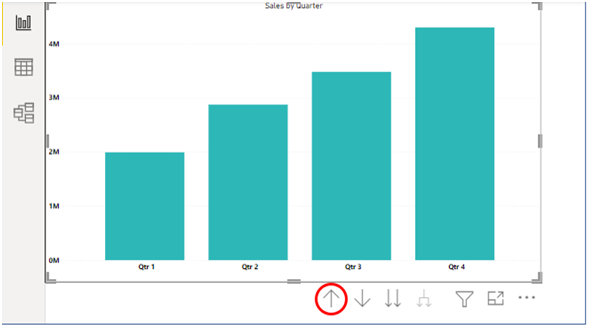
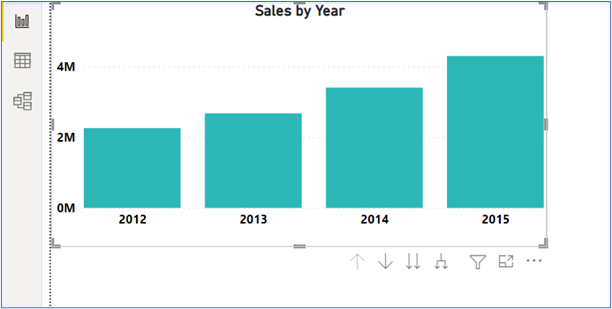
12. So now, if we press the drill up option, it will take us above levels from the current level, i.e., as shown below.
Days >> Months >> Quarters >> Years.
13. When we are at the first hierarchy level, i.e., “Years,” we can see the “Expand” option is enabled.
14. This will expand everything at once. Click on this option to see its impact.
15. By clicking on this option once it has taken us one hierarchy down, i.e., “Year & Quarter,” now click one more time to see “Yearly, Quarterly & Monthly.”
16. “X-Axis” values don’t look neat, isn’t it? This is more to do with settings of the “X-Axis,” first come back to the “1stHierarchy” level,i.e., “Year.”
17. Now click on the “Format” option. Click on the “X-Axis” drop-down list.
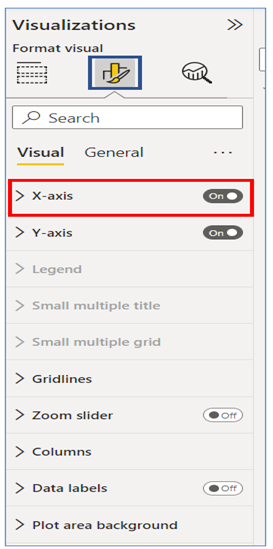
18. From “Type,” choose “Categorical” as the option.
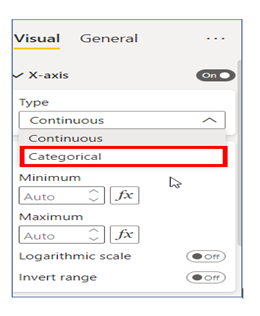
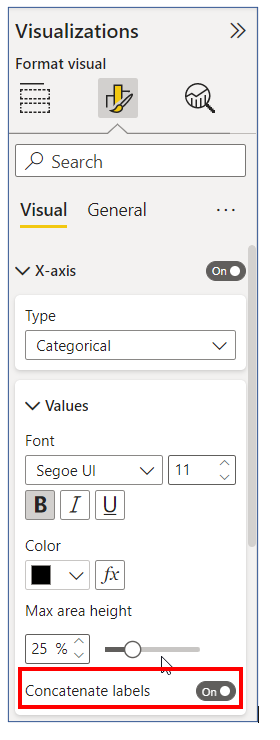
19. The moment you choose “Categorical” as the “Type” option at the bottom of the same “X-Axis” option, it will enable the “Concatenate Labels” option. “Turn Off” this feature.
20. After this, click on the “Expand” option to see the neat alignment of “X-Axis.”
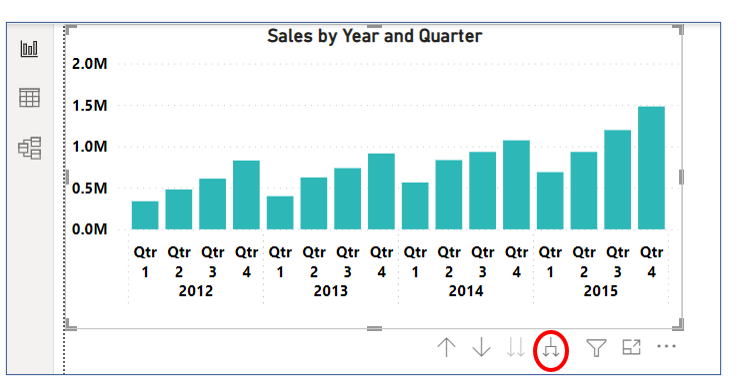
We can see “Year” only once for all the four quarters.
Drill Down Feature for Non-Date Columns
We can apply this drill-down feature not only for columns but also for non-date columns.
- For example, we need to see “Category-wise” and “Sub-category-wise” drill down a summary for this first insert “Category-wise” chart.
Nicely quoted !!
Nice Blog!!