
Reporting is essential for timely and effective monitoring of contact center performance. Contact center dashboards provide managers, supervisors, and agents a detailed look at the current state of their contact centers. In this blog post, I will talk about the different reporting features that are available within PACE, such as Supervisor Dashboards with pre-configured templates, Agent Console Queue Metrics, Scheduled Reports, and PACE Data Connector capabilities.
Customizable Supervisor Dashboards
Supervisor Dashboards allow supervisors to quickly understand the overall contact center performance and identify areas that require their immediate attention. PACE comes with a pre-configured Supervisor Dashboard and five different dashboard templates.
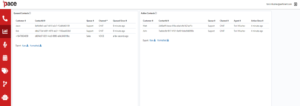
The Contacts Dashboard template gives an overview of the most recent contacts, including customer name and agent name, along with any information about the call from a disposition, a sub-disposition, or a regular note.
Also, there is a post-interaction Survey section where supervisors have visibility into what responses have been selected by the most recent contacts. This information can serve to identify the overall customer satisfaction with the provided support.
The Agent Dashboard template gives information about agent activity and performance. With this template, supervisors can view agents’ availability in near-real-time and determine if additional staff is required.
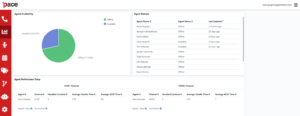
In the Agent Performance Today section of the dashboard, supervisors can easily determine how many contacts each agent has handled throughout the day, broken down per channel.
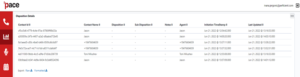
The Queue Live View Dashboard template provides supervisors with the names or caller Ids of the callers currently waiting to be answered in the queue and the callers currently connected with an agent. Out of the box, ContactId column can display a phone number or a chat username, as well as the platform the chat is coming from – like web chat, Facebook, Instagram, etc.

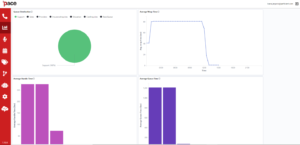
Queues Overview template contains charts that display information such as:
- Queue Distribution – showing a live count of all contacts waiting in a queue on a per queue basis.
- Average Wrap Time – showing how much time the agents spend in After Call Work status while wrapping up their contacts.
- Average Handle Time and Queue Time – showing average handle time and average length of time that customers need to wait until their contact is answered by an agent, broken down per queue.
Contact Center Overview dashboard template allows supervisors to drill down into the daily contact center metrics. The provided data includes agents’ availability, service level, the number of handled contacts, average answer time, and similar metrics.
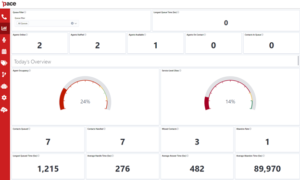
All dashboard templates are fully customizable, and metrics can be easily removed, added, or changed based on business requirements. For example, if you decide that you need to change the Service Level metric from 20 to 30 seconds, you can do this by editing the SLA visualization configuration without any development work. Even if your requirements change frequently, you can change things to look exactly the way you want without spending any extra money on refactoring the code.
Overview of Agent Console Dashboard
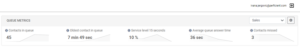
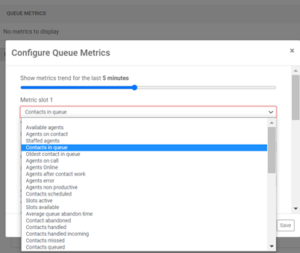
With Queue Metrics displayed on their Agent Consoles, agents can see the live status of their contact center. This is an effective way to improve their performance and increase engagement. Agents might also find it useful to know how many callers are waiting in the queue before their breaks, lunch, or end of shifts without navigating from the Agent Console or interrupting their current contacts. They can filter the view per queue or have the general overview displayed for all queues. PACE supports adding up to 12 different metrics slots that are configured per agent such as Contacts in Queue, Contacts Abandoned, Average Hold Time, SLA status, etc.
Scheduled Historical Reports
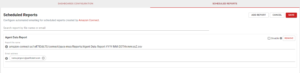
In Amazon Connect, reports can be scheduled to be exported to an S3 bucket on a regular basis, however, this still requires supervisors to manually check for the reports. With PACE, you configure the email addresses that should receive an historical report from Amazon Connect. First, select the desired historical report from Amazon Connect and select how often and at what time to send the report – daily, weekly, or monthly at a specific time of the day. Then you enter that report file name into the PACE Admin Console along with the email addresses. Amazing how scheduling can save a lot of time by minimizing manual intervention! This also allows for efficient and timely distribution of contact center metrics to supervisors and business leaders.
PACE Data Connector
Many organizations want to use specific tools to perform data analytics and create custom reports that best fit their business needs. These tools require contact center data to be exported and easily imported for further analysis. Amazon Connect captures the contact data in a JSON format, and some of the metrics include hold time, wait time, agent interaction time, and any other custom contact attribute relevant to a specific contact. Out-of-the-box, PACE comes with pre-configured streams for Contact Trace Records (CTR), Agent Events, and API metrics that you can configure on the Amazon Connect Data Streaming settings page. Once configured, all new data will be exported to an S3 bucket into designated folders named ctr and agent-events. From there, you can easily extract the data and pull it into a third-party reporting analytics tool of choice.
Regardless of whether you care about specific metrics or about overall continuous improvement, reports are key to measuring your contact center’s success. With the right PACE reports and with consistent oversight, you will find ways to improve your internal processes to further enhance your business.
If you’re interested in maximizing your contact center’s efficiency, we can help. At Perficient, we are an APN Advanced Consulting Partner for Amazon Connect which gives us a unique set of skills to accelerate your cloud, agent, and customer experience.
Perficient takes pride in our personal approach to the customer journey where we help enterprise clients transform and modernize their contact center and CRM experience with platforms like Amazon Connect, PACE, and more.
For more information on how Perficient can help you get the most out of Amazon Connect, please contact us here.