
Edit interaction is valuable feature in Power BI which used to manage the interaction between the visuals.
- Generally, Power BI visuals are interactive that is after selecting any item of visual affects other visual too.
- So here Edit Interaction helps in controlling the interaction between the visuals.
- Which helps in making efficient and also it makes sure that the visuals show the insights that we need.
Now we will see how we can control interactions of visuals:
Controlling Interactions of Visuals in Power BI
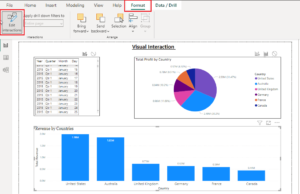
- For changing the interaction of a visual to other visuals select the visual that you want to control the effect of that on other charts, For example in figure …. Revenue by Countries column chart has been selected that is we will see the interaction of this chart on other visual that is Pie chart (Total Profit by Country)
- After selecting visual then select Edit interactions which we get after clicking ‘Format’ pane located at the top of the screen. (Refer to figure)
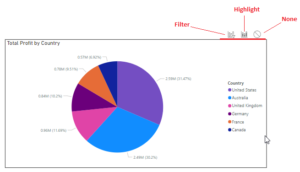
- After clicking on Edit interactions, you will see small icons at the top of each of your visuals for the following options shown in below image:
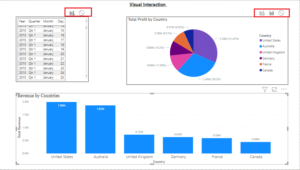
From the image we can observe following options of controlling interaction:
1) Filter
2) Highlight
3) None
Note: Not every visual has all 3 options of interaction, it depends visual to visual like in the figure we can see that in the Table chart we have only two options: ‘Highlight’ and ‘None’ and whereas Pie chart supporting 3 options of interaction.

Now we will see each option with their functioning:
1.Filter –
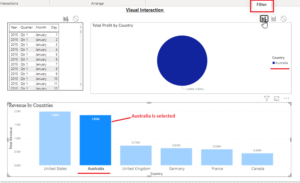
- Let’s start with Filter option in interaction, it is used when we want filter visuals with selected data, here visual will show data related to selected option.
- As an example, in figure… Australia country is selected from Column chart (Revenue by Countries) and for that selection we can observe that Pie chart is showing only data related to Australia (purple colour).
- In case of multiple visuals this option will be very useful where we want to filter the visuals with required condition.
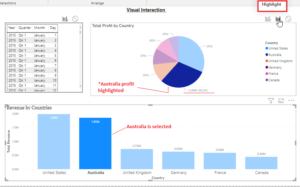
2. Highlight –
- We have seen in the Filter selection visual get filtered by applied selection and the same thing happens in Highlight option.
- But here the impacted part is Highlighted. All data is displayed but the selected option is more focused.
- Let’s understand with example from the figure…. We have selected Australia from the Column chart (Revenue by Country) and for that selection Australia total profit is highlighted in the pie chart (Total Profit by Country).
3. None
- Now we will see the 3rd option, which is used for turning off the Interactions. As name suggests it simply used to avoid any filtering in the visual.
- By using None option, we can stop the effects on the visual after the selection.
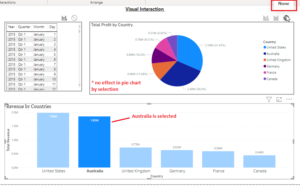
- In the example displaying in figure…. we have set None for Pie chart visual. And we can observe that after selecting Australia option from Column chart there is no effect on the pie chart. That is there is not interaction between these two visuals.
- In the scenario of having multiple visuals, this option is very helpful, we can stop interaction on multiple visuals.
Conclusion
In this blog we have gone through multiple options by which we can control interaction between the visuals. We can filter or highlight the visual interaction and also turn off the effects of interaction on other visuals. It’s very impactful feature of Power BI which helps in making efficient and checks whether our dashboard meets the requirement.
Happy Reading!!
Useful