
Power BI filters are useful tools for organizing data, visualizing and comparing your data visualizations, and creating reports. They are utilized to sort data according to a chosen condition.
Filter Types :
- Visual Level Filter
- Page Level Filter
- Report Level Filter
- Drill Through Filter
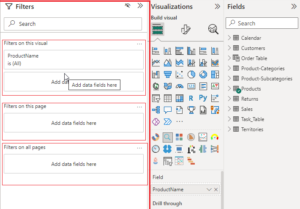
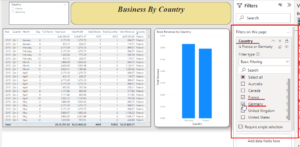
On the right side of the dashboard, locate the Filter Pane. From there, we may apply all of these filters. (refer to the image below)
Now we will see each filter type in detail, like how to apply them and also the type of filtering that can be applied:
1. Visual Level Filter:
This Filter is used in sorting single visuals, for example, cards, slicers, bar charts, maps, and other visuals. Filtering is done at a granular level. Let’s see the steps involved in it with an example:
Step 1: Expand Visualizations, Filters, and Fields panes from the right side.
Step 2: To apply a visual filter, you just have to click a visual that you want to filter; for example, in the below image we have to click Sunburst visual.
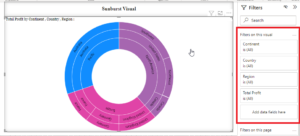
Visual Level Filter for Sunburst visual with fields
Step 3: After that, select the field we want to filter from the Filters pane. Here in the below image, we have chosen the ‘Continent’ field and from that ‘Europe’ option. As a result, Sunburst visual will filter as per the selected option. (refer to the below image)
We can also do multiple selections and also new Data field can be added there.
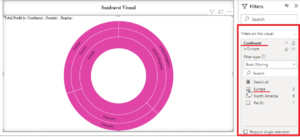
Sunburst Visual after applying a filter of ‘Europe’ from field ‘Continent’
2. Page Level Filter:
Page level filter used to apply filters on a single page of a report applies filters to all the visuals present on that page.

Step 1- To use page-level filters, use the option “Filters on this page” from the Filters pane
Step 2- Drag and drop a field based on which you wish to sort the information on a report page. In the image below we can see that the ‘Country’ field is dragged into selection.
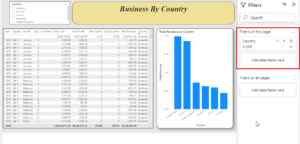
And in the below image whole page is being filtered by selecting ‘France’ and Germany’ from the ‘Country’ field, so the whole page will show details related to these 2 countries only. Here we can make both single and multiple selections as needed.
3. Report Level Filter:
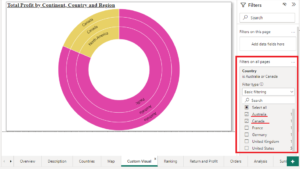
To apply a filter to the entire report, that is, to all the pages of a report uniformly, we use report-level filters. To apply this filter, drag and drop a field from the Fields section into the ‘Filter on all Pages’ section. Let’s start with the below examples we have filtered the whole report by selections ‘Australia’ and ‘Cannada’ from the data field ‘Country.’
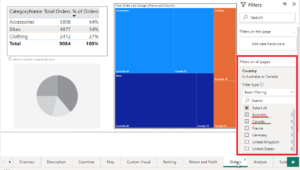
As we can now see, the Report pages – ‘Orders’ and ‘Custom Visual’ are getting filtered and showing only data related to country Australia and Cannada.
4. Drill Through Filter:
By using this filter, we can focus on specific entities or on a particular field. This filter helps us to get a deeper insight into the data we want. For that, we first add the fields in the drill-through section. We can analyze any part of the data set and create any drill-through views.
I will focus more on Drill through filter and step by step process of creating it in the next blog series. Stay tuned!
Till now, we have seen types of filters in Power BI; now we will look into modes of Filtering:
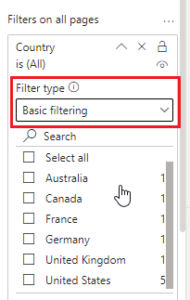
1. Basic filtering: It’s a very basic form of filtering, which is applicable in all 3 forms of filters. Here simply we can select an option by which we want to filter and also search the options, like country names. (Refer to the below image)
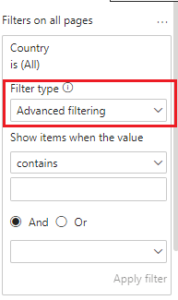
2. Advanced filtering: This filtering is also present in all 3 types of filters we have seen above. In the figure, we can see how we do advanced filtering. It has a unique and important role; by this filtering, we can find ranges of data by applying some conditions or rules. It gives you more precise control over what you want to filter out.
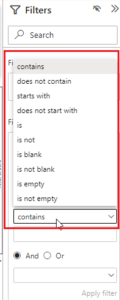
Based on the type of columns, advanced filtering capabilities vary. In the second image, we can see the set of rules or conditions we can apply.
So this was all about filters and filtering in Power BI. It is a very useful feature that helps in sorting our data and making an effective and efficient dashboard.