Azure Load Testing
Performance and Load testing are an integral part of the Software Development Life Cycle. These tests can be used to find performance bottlenecks, help right-size infrastructure, find the correct thresholds when setting up scaling mechanisms, and see how your application will react under an excessive load.
Consider a retail eCommerce application gearing up for the holiday season as an example. The retail company expects the traffic to their application to increase significantly based on the traffic patterns from previous years and are running an increased number of sales promotions this year. The company needs to be sure that their application will be able to handle the increased load without interruption.
However, running load and performance tests and analyzing the results isn’t always straight forward. Running heavy tests on a simple laptop or your local computer will almost always bog down your machine. You might even have to create additional infrastructure to be able to simulate the required load necessary for your tests.
Once you pass those hurdles and run the tests, the next challenge is identifying your problem areas. Do you have a centralized dashboard monitoring all the required infrastructure for your application? Or do you have to manually go through each component (database, web server, file store, etc) in your application’s stack to try and stitch together how each component handled the load pushed to your application? What happens if you change the load, or if you change underlying infrastructure? Will you be able to compare multiple runs?
Simplify Performance and Load Testing with Azure
Azure has introduced Azure Load Testing, a fully managed suite built to ease the process of load testing your applications within Azure. Here are a few things Azure Load Testing can help you do:
- Set up a robust virtual machine to run load tests and push the load on your application
- Monitor the system response times from a single dashboard
- View the performance metrics for each component of your application’s infrastructure on a single view to easily pinpoint bottlenecks within the system
On top of the single pane dashboard view provided, Azure Load Testing also keeps a historical log of all your past tests – so if you change the infrastructure for the application or the load applied, you can quickly compare multiple runs against each other to see the impact on your application.
Explore More Content – The Azure Well-Architected Framework: Performance Efficiency Pillar
How does Azure Load Testing work?
To start, create an Azure Load Testing resource. You can do this using Infrastructure as Code scripts with ARM or PowerShell, OR you can just provision via the Azure Portal. Very little configuration is required upfront to create this resource: simply enter the Azure Load Testing service name, the resource group where it should be placed, and the Azure Region where it should be located.
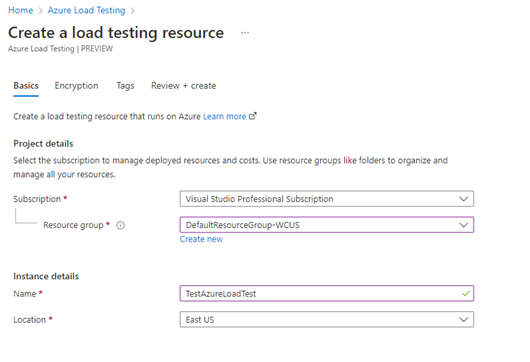 Once the service is created, you are ready to start creating tests. There are two options for creating tests:
- A quick test to simulate a number of users for a duration of time to a URL
- Upload a JMeter test script
While the first option may be useful for very basic testing, this article will be focusing on the tests utilizing JMeter tests scripts as this is more robust and provides a lot of flexibility to build complex business logic in your tests.
JMeter for Robust and Flexible Tests
JMeter is a powerful open-source tool designed for load and performance testing. With JMeter, you have the ability to create very robust tests.
Although not required, downloading JMeter is recommended to use the UI for creating your test plan. If you are already seasoned with JMeter, you can also manually create the JMX (a XML formatted script file) for the test.
The main element is the Thread Group, but you can review the following to understand the different elements that can be used to create a test plan.
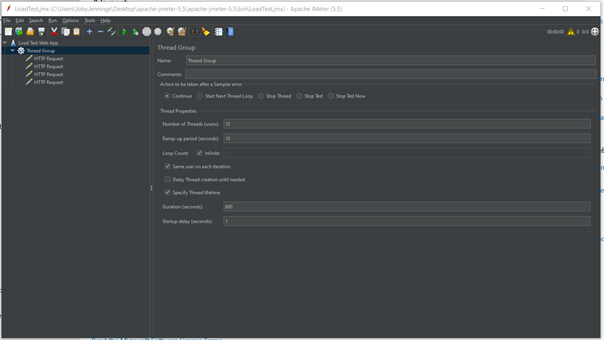 The thread group controls the number of threads (virtual users) that you would like to simulate against your application, the ramp up time to get to the full number of threads, and the number of times you would like to execute the test.
You can add things like Samplers (HTTP Requests) and Logic Controllers (Customize logic for when to send requests) to the thread group to create your test. When you create a thread group, you want it to simulate a logical workflow within the application.
Looking at the earlier example of a retail eCommerce application, the workflow could be:
- Get information about item for sale
- Verify the item isn’t out of stock
- Add item to cart
- Purchase item
- Send email verification of purchase
While this example is basic, as a SME of your application you will want to identify the main logical workflow(s) to test. If there are multiple, you can create multiple thread groups for each workflow.
Once you have your test plan created, it is good practice to set the number of threads to 1 and the loop count to 1 to verify that your test works. Once it is working, it is ready to be used within the Azure load testing tool. (NOTE: for load tests requiring over 250 threads, you need to set the number of threads to 250. The Azure Load Testing tool will create multiple test engines to create more threads).
Creating the Test
With the JMeter script ready to go, we can now create the first test in our Azure Load Testing service. Within the Azure Load Testing service menu in the Azure Portal, navigate to the Tests section. From the Create dropdown, select the “Upload a JMeter script” option.
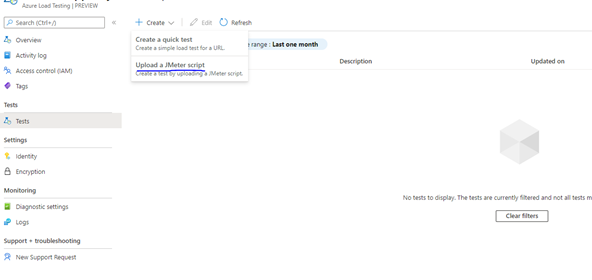 Go through each of the tabs and enter the required information.
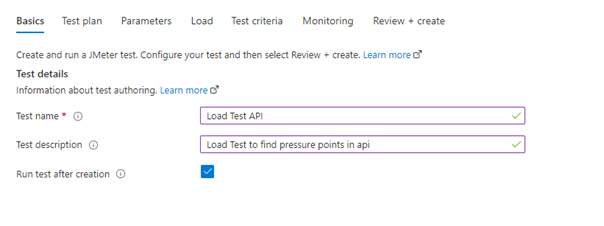

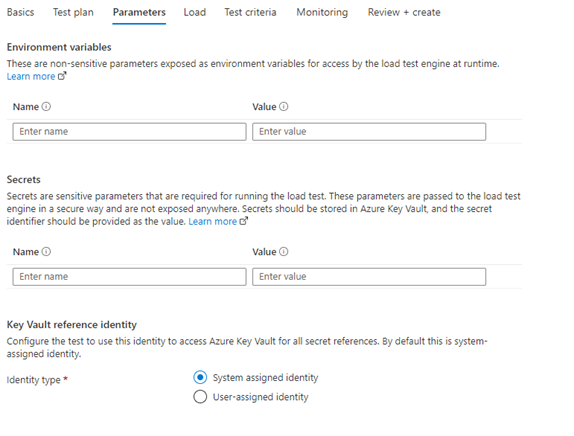 In the parameters tab you can pass in environment variables configured in your JMeter script. A good use case for this is configuring the base URL as an environment variable so the test can be run against different environments. You are also able to pass in key vault secrets here if you have things like passwords or tokens that you want to keep out of your script files.
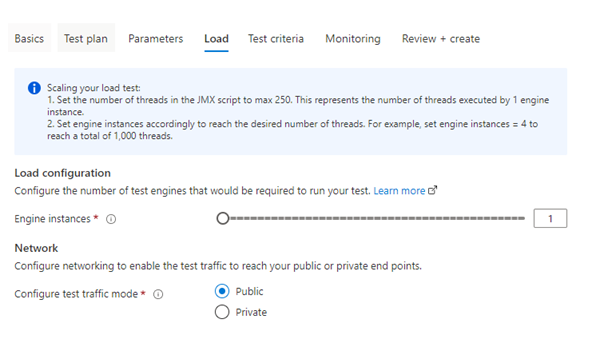 The Load tab will ultimately determine the number of threads that are used in the test. If your tests require more than 250 threads, you will have to use multiple engine instances to create the load.
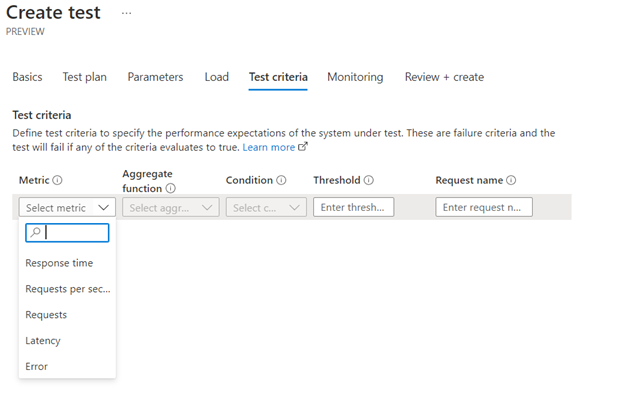 In the test criteria tab, you can specify the performance expectations for the system. This is a good way to ensure that SLAs are being met under load.
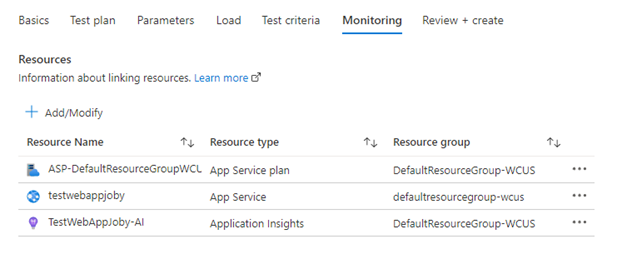 The monitoring tab allows you to select all the Azure Resources that you would like to monitor throughout your tests. This can include Azure Databases, Storage Accounts, Application Gateways, etc. Selecting all the external resources that your application utilizes is crucial for determining if issues seen under load are coming from the application itself or from other services.
With the required information filled out, you can create your first test. If you selected the Run After Creation checkbox in the Basic tab, the test would start once it is created. If you navigate to the test run, you should see Client-Side metrics as well as the metrics for the resources you selected.
(NOTE: it is recommended to initially check on the test run to confirm it ran without errors. As long as there were no errors in the initial test run, wait until the test completes to analyze the metrics.)
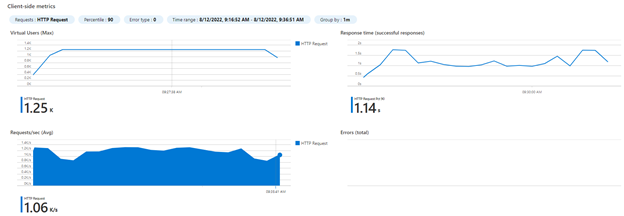
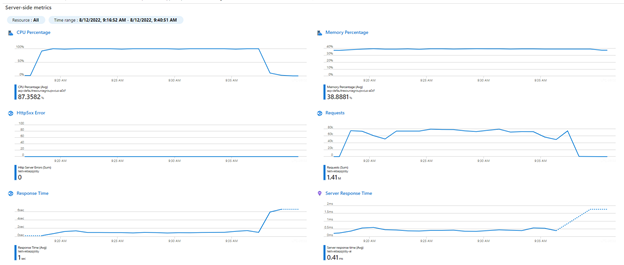 The metrics that are initially displayed for your Azure Resources are defaults that Azure has selected. However, you can configure other metrics to display or hide metrics that aren’t relevant.
 Adapt Your Environment based on Test Results
With your first test complete and the metrics analyzed, you can now make your changes. If you are looking to find performance bottlenecks, you can check for asymptotic behavior with your resources that might indicate slow performance.
For load testing, you can increase the load by editing the test and increasing the number of test engines. If new Azure Resources are added, you can edit the test and add these to the resources that are monitored. Regardless of the reason you are doing the test, make the necessary changes to either the load or the infrastructure and re-run the test.
With the second run complete, you can follow the above steps to view the results and metrics. If you navigate to the list of all of the runs, you also have the option to compare the runs.

 Using the comparison tools, Azure will overlay the metrics on the same graph, giving you the perfect view to determine how your changes have affected the performance of the application!
And that is about it! With a few clicks in the Azure Portal and some well-designed JMeter scripts, you can simulate production-levels of load on your applications to observe how it will perform, find bottlenecks where it may not have enough compute, memory, or storage, and validate that it is meeting your SLAs and SLOs.
Overall, the Azure Load Testing tool gives you one central location to run your load/performance tests, analyze both client-side metrics and service side metrics, and compare metrics from runs with differing load or infrastructure configurations.
Why Perficient?
We’ve helped clients across industries develop strategic solutions and accelerate innovative cloud projects. As a certified Azure Direct Cloud Solution Provider (CSP), we help you drive innovation by providing support to keep your Microsoft Azure operations running.
Whether your IT team lacks certain skills or simply needs support with serving a large business, we’re here to help. Our expertise and comprehensive global support will help you make the most of Azure’s rich features.
Contact our team to learn more.
