Depending on the use case call centers can rely on very different KPI’s for reporting. What can be a key metric for an inbound call center often turns out to be merely a nice-to-have if the call center focuses on quick outbound calls. In the end probably the most important reporting feature for a call center solution is giving supervisors the ability to choose among multiple reports, allowing admins to dig into just the data that is relevant for their use case.
Amazon Connect does exactly that, offering several reporting options that cover most common metrics used by a call center. However, between a dashboard, real-time metrics, historical metrics, a contact search as well as cloud watch dashboards and logs it can be a bit confusing to identify what are the best metrics for each call center and where to find them. In this post we’ll look at some common reporting areas and recommend some best practices when setting up an Amazon Connect instance.
While there are many ways to group and analyze call center information, we will focus on:
Productivity metrics. These are KPI’s that allow supervisors to identify how efficient agents are during the day and do basic workforce management.
Service quality metrics. These data points will help infer the customer experience and allow supervisors to quickly address pain-points.
Agent metrics. Along with quality assurance monitoring of calls and recordings these indicators will help determine how well agents are doing their job.
Productivity metrics
Productivity metrics are usually closely tied to agent utilization (total number of calls handled over number of work hours) and ultimately help supervisors make sure agent time is utilized in the most efficient way. These metrics will also help plan headcount and forecast how many agents are needed during particularly busy times.
While Amazon Connect doesn’t have any per agent costs that need to be handled ahead of time, supervisors can use the following metrics to monitor agent productivity:
- Occupancy (average percent of time agents are actively occupied/connected on a call)
- Average handle time
- After work time
- Number of calls handled and calls missed
One of the most useful reporting tools for monitoring day-to-day productivity is the real-time metrics agent report. This report offers several agent performance metrics including the four above and can be configured to show data for an entire day or just a few hours. This report will also allow supervisors to control agent status remotely and listen into calls for quality assurance purposes. Something to note about joining a call in silent mode is that the call must be recorded.
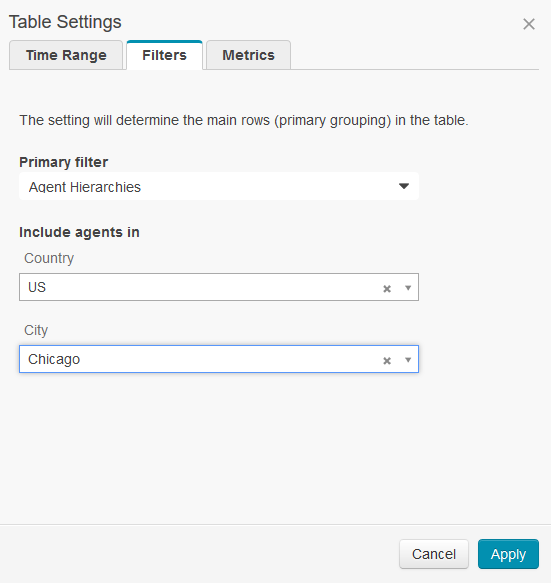
Agent reports have several filters which will determine the agents displayed including: queues, routing profiles and agent hierarchy. For a complex call center with multiple teams and supervisors it is almost always recommended to set up an agent hierarchy. While this may seem complicated at first it is a great tool to break out the call center into smaller units for reporting purposes.
To better understand how to make use of hierarchies consider the following example. Imagine you are running a call center which has locations in two countries and agents in several cities in each country. Your local supervisors want to be able to run reports on just agents in their country or city.
In order to set this up, navigate to Users-> Agent Hierarchy. We will start by configuring the countries as the first level of separation with cities falling underneath them.
After all the levels of the hierarchy are created it’s easy to set up countries and cities under the appropriate level. Just click on a country after it’s added to fill in the details for the appropriate cities.
Now when creating a new agent, we will select which country and which city they will be working in, which in turn will ensure they only show up in the appropriate reports.
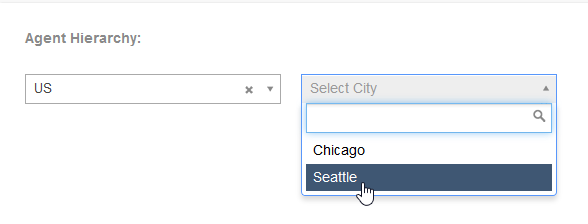
After everything is set up when looking at reports a supervisor in Chicago can easily filter out any agents who are in a different country or outside of Chicago. This report can be saved in order to make it even easier for supervisors to only see relevant data.
You can add up to 5 levels of hierarchy to make sure each supervisor only sees data that is relevant for them. For example, if each city has an IT and a Sales call center which report data differently each business unit can be added as a 3rd level. However, if supervisors will need to report on the entire IT organization rather than geography you should consider creating the Business unit (IT or Sales) as the first hierarchy level then add the agent’s location underneath. For more details on how to make use of agent hierarchy you can review the official Amazon documentation.
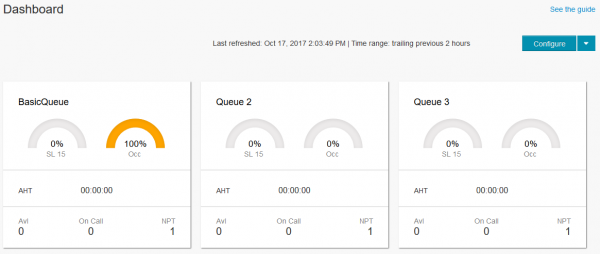
Another useful tool to visually understand and improve productivity is the dashboard, especially when used as a wallboard that agents can see and use to self-monitor. The dashboard is available from the home page after hiding the initial configuration guide (you can always open this guide by using the “See the guide” link in the top right corner.
From the “Configure” button supervisors can select which queues they want to monitor as well as determine what the percentage triggers are for color changes in the two gauges showing Service level and Occupancy.
Keeping this data visible to the entire call center will help identify if agents are falling behind in productivity and will allow supervisors to quickly bring in an overflow team if the service level is not met.
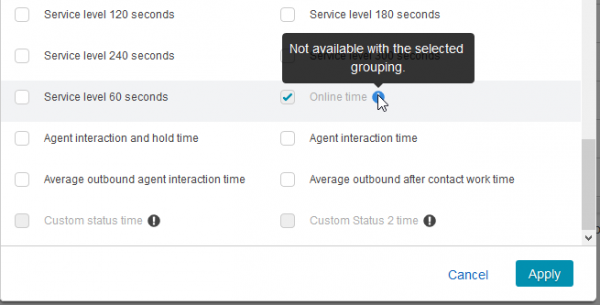
Finally, the best way to analyze historical productivity trends is making use of the agent performance historical metrics report. Something to note regarding all historical reports is that while the data can be grouped in several ways (by agent, by queue, agent hierarchy), some metrics will not be available unless the grouping makes sense. For example, if all data is grouped by queue, the report cannot show agent status data as an agent’s status is not correlated in any meaningful way to a queue.
For more details on grouping in historical reports you can review the Amazon documentation.
As with real- time reports these metrics can be filtered by hierarchy levels to get averages for just the relevant section of the call center. Going back to the example used above where we have a call center spread out across two countries and several cities, making use of agent hierarchy can quickly tell supervisors how all agents in the US are doing compared to agents in another country. Using a different level of the hierarchy we can tell how agents in a city are doing compared to agents in other cities.
Service quality metrics
Service metrics are usually focused on the caller’s experience; for example, how fast did they end up talking to the right agent or how long was the wait in queue. Combined with caller surveys these metrics should help supervisors identify ways they can improve customer service and streamline the call center. Some typical metrics used to measure service quality are:
- Average speed of answer
- SLA (how many calls were answered under a previously agreed upon service level)
- Average hold time
- Abandoned rate
- Call duration
- First call resolution rate
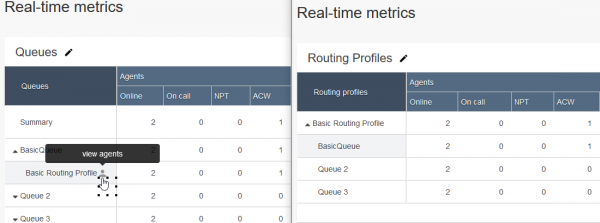
Supervisors can make use of either the queues or the routing profiles real-time metrics report, depending on how they need the data to be grouped. Something to note is that queue data will contain routing profiles sub-groups as well as a link that will pull up all agent’s that are part of that routing profile, making the queues grouping more useful for most day-to-day usage.
Below is an image showing the difference in grouping options. Note that the queues report also offers a summary of all queue data, while routing profiles can contain duplicates of the queues and therefore don’t offer a summary total.
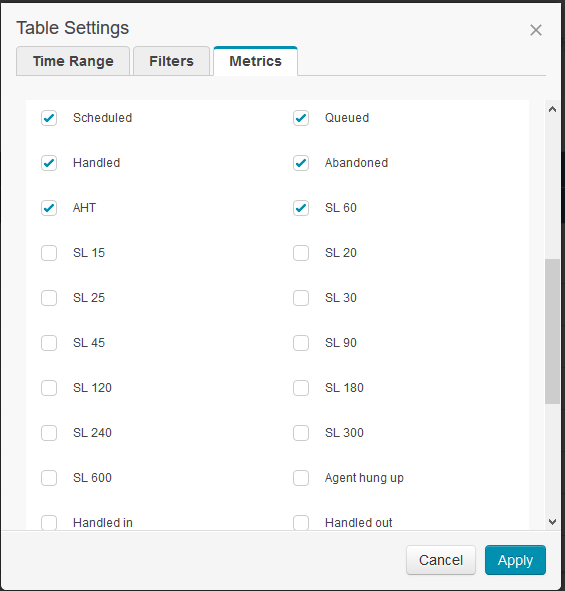
Something else to keep in mind is that while the service level cannot be configured on a per queue basis, reports will allow supervisors to select the most appropriate SL they want to report on in increments of 5 seconds (and doubling after 40 and 60 seconds).
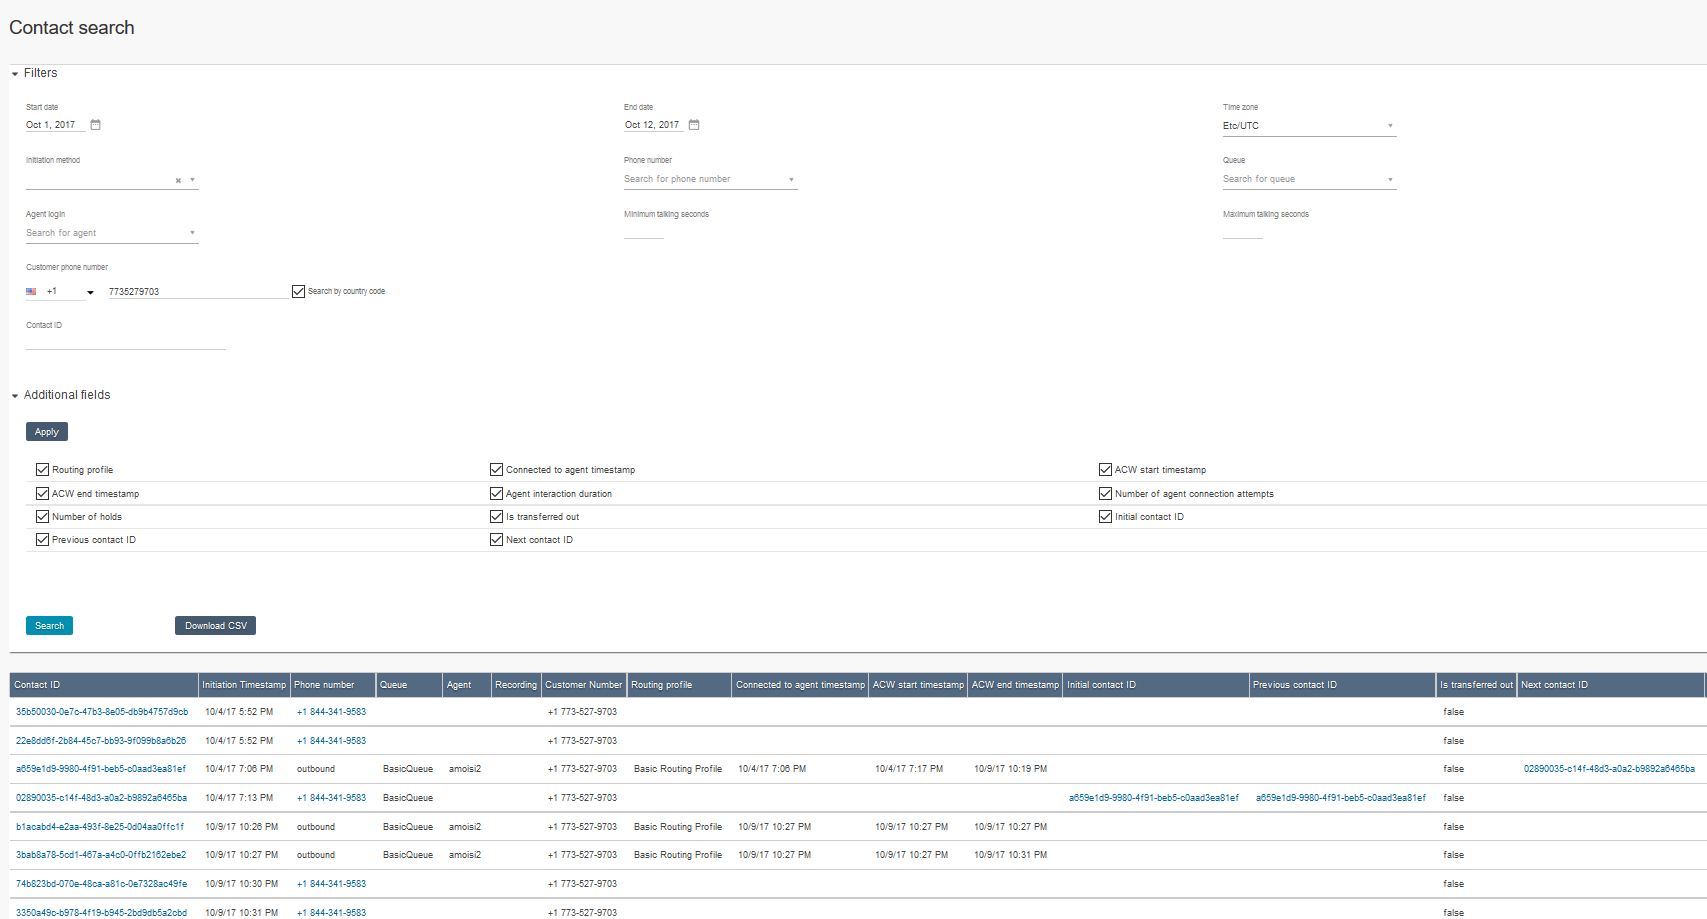
One of the metrics not immediately available on any report is the first call resolution rate. Amazon Connect does not have a historic or real-time report for all callers. However, using the contact search supervisors can look up all recent calls from a certain phone number or contact ID and gather details on several metrics.
This type of analysis can be very helpful in determining how many callers reach out multiple times, who are the agents they end up talking to and how fast their questions are resolved.
An additional metric that may be useful when considering the caller experience is looking at how many calls end up transferred out of the call center and on how many calls the agent had to consult with someone else to resolve the issue. An agent that routinely cannot resolve issues might need more training or should be moved to a different routing profile that routes easier calls to them first.
Finally, if more in-depth reporting on the caller is needed Amazon Connect can easily integrate with several CRM systems like Salesforce or ticketing systems like Freshdesk. If a full integration is not needed it is very easy to make use of a Lambda function to tracks the number of times a caller entered the call center and maybe even keep track of the call reason. If this type of tracking sounds interesting a good starting point could be this premium call flow guide.
Agent metrics
Besides making sure callers have a positive experience while the call center remains efficient supervisors must also make sure agents are adhering to QA standards and completing their tasks in a reasonable time frame. To make it easier to do this Amazon Connect offers a few agent specific reporting options:
- Agent status report
- Agent activity audit
- Quality assurance analysis tools
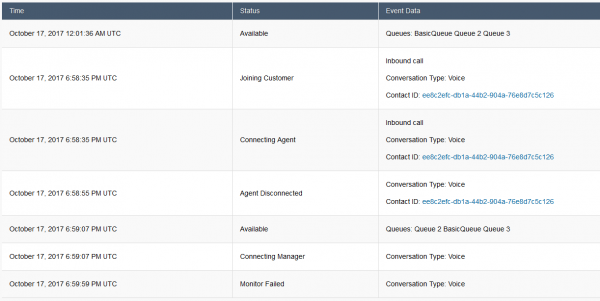
Both the agent status report and the activity audit are available under historical metrics and are a bit different from other reports. While most reports in Amazon Connect either show the current call center status or group data to calculate average performance these two agent reports are focused on just providing all relevant status data for certain agents.
The agent status report will show how long an agent was online, when they logged on and when they logged off. This is a perfect way to keep track of how long agents work each day. Note that you can also pull all the agents within a routing profile into a report if the work hours of an entire team of agents are needed.
If more details are needed about the agent, for example how long they were in a status as well as details on the calls they handled the agent activity audit will provide more detailed information for any given day.
From the agent audit status, it’s easy to navigate to the contact search page and gather more details about each call the agent handled.
While there are several other ways to slice the data gathered by Amazon Connect, hopefully this post helped point you in the right direction and gave you some ideas on what you should consider while setting up your call center. To talk to our experts about our Amazon Connect solutions, email Craig Reishus.


