
Hello Trailblazers!
Salesforce dashboards are powerful tools for data visualization and analysis. Dynamic dashboards, for example, provide real-time insights tailored to each user’s data visibility. Since an organization can only create a limited number of dynamic dashboards, it’s crucial to track and manage them efficiently.
This blog will explore various ways to check the number of dynamic dashboards in Salesforce.
So, let’s get started.
Before You Begin
In the previous part of the Salesforce Dashboards blog series, we explored what Salesforce dynamic dashboards are and how to create them. Before moving forward, I encourage you to read the previous blog in this series.
What is a Dynamic Dashboard?
A dynamic dashboard is a type of Salesforce dashboard that allows users to see data according to their own security settings rather than the dashboard creator’s settings. Unlike standard dashboards that run under a specific user’s permissions, dynamic dashboards adapt to the viewer’s access levels, making them highly useful for role-based data visibility.
Why is it Important to Track Dynamic Dashboards?
Salesforce imposes a limit on the number of dynamic dashboards per edition:
- Enterprise Edition: Up to 5 dynamic dashboards.
- Both Unlimited and Performance Editions can have up to 10 dynamic dashboards.
- Developer Edition: Up to 3 dynamic dashboards.

Exceeding this limit may prevent the creation of new dynamic dashboards and impact reporting capabilities. Hence, tracking the number of existing dynamic dashboards is essential.
Methods to Check the Number of Dynamic Dashboards
1. Using Salesforce Reports
To create a report fetching Dynamic Dashboards, we must create a Custom Report Type first.
Steps to Check Dynamic Dashboards
- Go to Setup and search for Report Types in the Quick Find Box.
- Create a new Custom Report Type there and name it.
- Select “Dashboard” as the primary object for your custom report type, complete the other process, and save it.
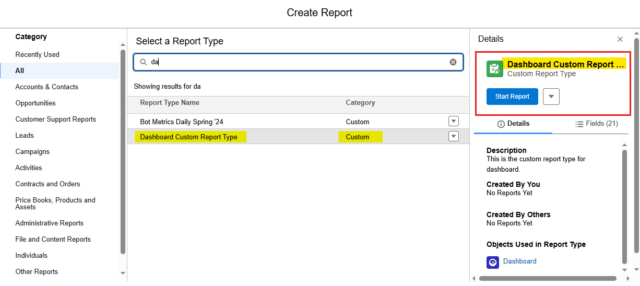
- Click New Report.
- Select the custom report type that you created and click Start. Follow the image below for reference.
- Go to the Filters and ensure that you select the “All Dashboards” option for a comprehensive view.
- Set the date range to All Time to capture all relevant data.
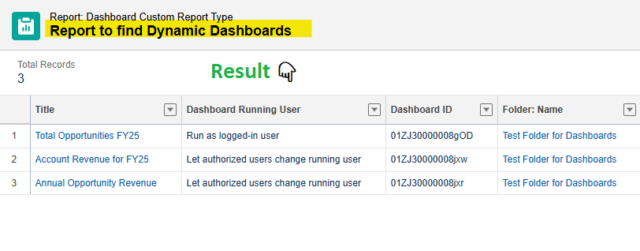
- Go to the Outline section, then Columns, and add the Dashboard Running User, Dashboard ID, etc, fields to the report for better visibility.
- Apply the following filter: Dashboard Running User = “Run as logged-in user, Let authorized users change running user” to identify dynamic dashboards.
Now, your filter section should appear as shown below: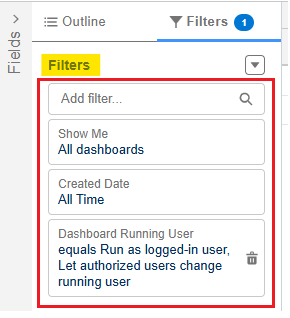
- Save and run the report. The filtered results will display all Dynamic Dashboards to which you have access.
2. Using the Developer Console
In the Developer Console, you can query the metadata to find the number of dynamic dashboards using SOQL (Salesforce Object Query Language).
Steps
- Open Developer Console.
- Go to Query Editor.
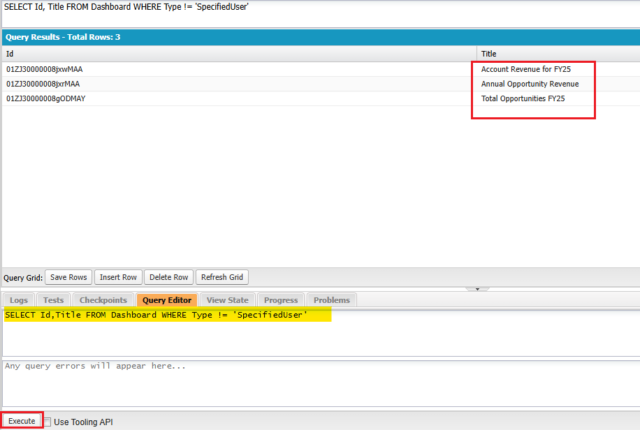
- Enter the following SOQL query:
SELECT Id, Title FROM Dashboard WHERE Type != 'SpecifiedUser'
- Click Execute.
- This will return Dynamic Dashboards not in private folders as shown below.
- You can also use the following query:
SELECT Id, Title FROM Dashboard USING SCOPE allPrivate WHERE Type != 'SpecifiedUser'
- This will return Dynamic Dashboards that are in private folders.
3. Using Workbench
Workbench is a powerful tool that allows you to query Salesforce metadata.
Steps
- Log in to Workbench (https://workbench.developerforce.com/).
- Select SOQL Query under Queries.
- Enter the query and click Execute.
- Click Execute.
- Review the list of dynamic dashboards.
4. Using Salesforce Setup
If you want a quick way to check dynamic dashboards without running reports or queries:
- Go to Setup.
- Search for Dashboards in the Quick Find box.
- Click Dashboards.
- Review the dashboards and check the Running User column. If it says “Run as Logged-in User or The Dashboard Viewer,” then it’s a dynamic dashboard.
Best Practices for Managing Dynamic Dashboard
- Regularly Audit Dashboards: Review existing dynamic dashboards periodically to ensure they are necessary.
- Optimize Usage: Use dynamic dashboards only when needed to avoid reaching the limit. I mentioned the limits of dynamic dashboards in the previous part of this blog post.
- Use Standard Dashboards: If a standard dashboard can achieve the same outcome, it is preferred over a dynamic one.
- Leverage Scheduled Reports: Instead of dynamic dashboards, use scheduled reports to send insights to users without consuming dashboard limits.
Conclusion
Tracking the number of dynamic dashboards in Salesforce is crucial to avoid hitting the platform limits. You can easily check and manage dynamic dashboards using methods like Salesforce reports, SOQL queries, Workbench, and Setup. Following best practices, you can optimize dashboard usage and ensure smooth reporting operations in your Salesforce org.
‘Happy Reading!
“Positivity is like a ripple in water—one small act of optimism can create waves of change. Embrace each challenge with a smile, for even the darkest clouds make way for the brightest sunshine…”
Related Posts:
You Can Also Read:
- Introduction to the Salesforce Queues – Part 1
- Mastering Salesforce Queues: A Step-by-Step Guide – Part 2
- How to Assign Records to Salesforce Queue: A Complete Guide
- An Introduction to Salesforce CPQ
- Revolutionizing Customer Engagement: The Salesforce Einstein Chatbot