CloudFront, Amazon’s Content Delivery Network (CDN), accelerates website performance by delivering content from geographically distributed edge locations. But how do you understand how users interact with your content and optimize CloudFront’s performance? The answer lies in CloudFront access logs, and a powerful tool called AWS Athena can help you unlock valuable insights from them. In this blog post, we’ll explore how you can leverage Amazon Athena to simplify log analysis for your CloudFront CDN service.
Why Analyze CloudFront Logs?
CloudFront delivers data, videos, applications, and APIs to customers globally with low latency and high transfer speeds. However, managing and analyzing the logs generated by CloudFront can be challenging due to their sheer volume and complexity.
These logs contain valuable information such as request details, response status codes, and latency metrics, which can help you gain insights into your application’s performance, user behavior, and security incidents. Analyzing this data manually or using traditional methods like log parsing scripts can be time-consuming and inefficient.
By analyzing these logs, you gain a deeper understanding of:
- User behaviour and access patterns: Identify popular content, user traffic patterns, and potential areas for improvement.
- Content popularity and resource usage: See which resources are accessed most frequently and optimize caching strategies.
- CDN performance metrics: Measure CloudFront’s effectiveness by analyzing hit rates, latency, and potential bottlenecks.
- Potential issues: Investigate spikes in errors, identify regions with slow response times, and proactively address issues.
Introducing AWS Athena: Your CloudFront Log Analysis Hero
Amazon Athena is a serverless query service that allows you to analyze data stored in Amazon S3 using standard SQL. Here’s why Athena is perfect for CloudFront logs:
- Cost-Effective: You only pay for the queries you run, making it a budget-friendly solution.
- Serverless: No infrastructure to manage – Athena takes care of everything.
- Familiar Interface: Use standard SQL queries, eliminating the need to learn complex new languages.
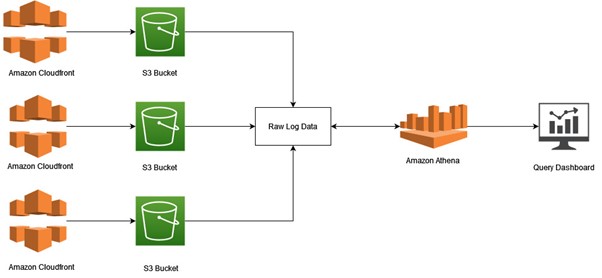
Architecture:

Getting Started with Athena and CloudFront Logs
To begin using Amazon Athena for CloudFront log analysis, follow these steps:
1. Enable Logging in Amazon CloudFront
If you haven’t already done so, enable logging for your CloudFront distribution. This will start capturing detailed access logs for all requests made to your content.
2. Store Logs in Amazon S3
Configure CloudFront to store access logs in a designated Amazon S3 bucket. Ensure that you have the necessary permissions to access this bucket from Amazon Athena.
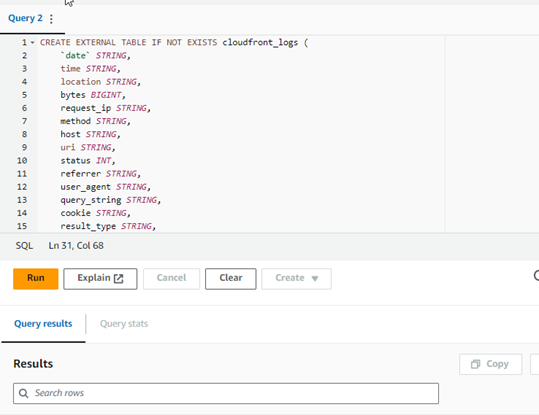
3. Create an Athena Table
Create an external table in Amazon Athena, specifying the schema that matches the structure of your CloudFront log files.
Below is the sample query we have used to create a Table :
CREATE EXTERNAL TABLE IF NOT EXISTS cloudfront_logs (
date STRING,
time STRING,
location STRING,
bytes BIGINT,
request_ip STRING,
method STRING,
host STRING,
uri STRING,
status INT,
referrer STRING,
user_agent STRING,
query_string STRING,
cookie STRING,
result_type STRING,
request_id STRING,
host_header STRING,
request_protocol STRING,
request_bytes BIGINT,
time_taken FLOAT,
xforwarded_for STRING,
ssl_protocol STRING,
ssl_cipher STRING,
response_result_type STRING,
http_version STRING,
fle_encrypted_fields STRING,
fle_status STRING,
unique_id STRING
)
ROW FORMAT DELIMITED FIELDS TERMINATED BY ‘\t’ ESCAPED BY ‘\’ LINES TERMINATED BY ‘\n’
LOCATION ‘paste your s3 URI here’;
Click on the run button!

Extracting Insights with Athena Queries
Now comes the fun part – using Athena to answer your questions about CloudFront performance. Here are some sample queries to get you going:
Total Requests
Find the total number of requests served by CloudFront for a specific date range.
SQL
SELECT
COUNT(*) AS total_requests
FROM
cloudfront_logs
WHERE
date BETWEEN ‘2023-12-01’ AND ‘2023-12-31’;
Most Requested Resources
Identify the top 10 most requested URLs from your CloudFront distribution. This query will give you a list of the top 10 most requested URLs along with their corresponding request counts. You can use this information to identify popular content and analyze user behavior on your CloudFront distribution.
SQL
SELECT
uri,
COUNT(*) AS request_count
FROM
assetscs_cdn_logs
GROUP BY
uri
ORDER BY
request_count DESC
LIMIT 10;
Traffic by Region
Analyze traffic patterns by user location.
This query selects the location field from your CloudFront logs (which typically represents the geographical region of the user) and counts the number of requests for each location. It then groups the results by location and orders them in descending order based on the request count. This query will give you a breakdown of traffic by region, allowing you to analyze which regions generate the most requests to your CloudFront distribution. You can use this information to optimize content delivery, allocate resources, and tailor your services based on geographic demand.
SQL
SELECT
location,
COUNT(*) AS request_count
FROM
cloudfront_logs
GROUP BY
location
ORDER BY
request_count DESC;
Average Response Time
Calculate the average response time for CloudFront requests. Executing this query will give you the average response time for all requests served by your CloudFront distribution. You can use this metric to monitor the performance of your CDN and identify any potential performance bottlenecks.
SQL
SELECT
AVG(time_taken) AS average_response_time
FROM
cloudfront_logs;
Number of Requests According to Status
The below query will provide you with a breakdown of the number of requests for each HTTP status code returned by CloudFront, allowing you to identify any patterns or anomalies in your CDN’s behavior.
SQL
SELECT status, COUNT(*) as count
FROM cloudfront_logs
GROUP BY status
ORDER BY count DESC;
Athena empowers you to create even more complex queries involving joins, aggregations, and filtering to uncover deeper insights from your CloudFront logs.
Optimizing CloudFront with Log Analysis
By analyzing CloudFront logs, you can identify areas for improvement:
- Resource Optimization: Resources with consistently high latency or low hit rates might benefit from being cached at more edge locations.
- Geographic Targeting: Regions with high traffic volume might warrant additional edge locations to enhance user experience.
Conclusion
AWS Athena and CloudFront access logs form a powerful duo for unlocking valuable insights into user behavior and CDN performance. With Athena’s cost-effective and user-friendly approach, you can gain a deeper understanding of your content delivery and make data-driven decisions to optimize your CloudFront deployment.
Ready to Unleash the Power of Your Logs?
Get started with AWS Athena today and unlock the hidden potential within your CloudFront logs. With its intuitive interface and serverless architecture, Athena empowers you to transform data into actionable insights for a faster, more performant CDN experience.


Very informative.