Have you ever had a scenario where you need to Display the last 6 month or 4 month or N months of data just by selecting a single date dimension in slicer, sounds difficult“?
Let’s me show you step by step how to display last N months of data just by selecting single date dimension in slicer.
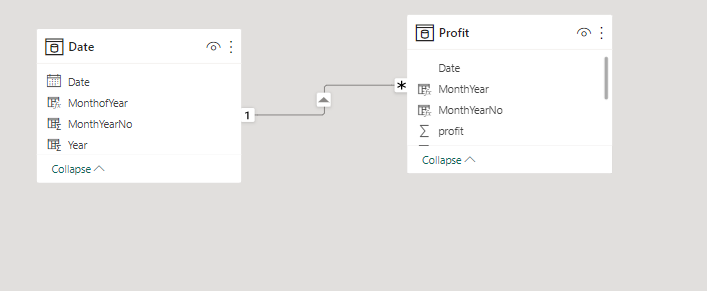
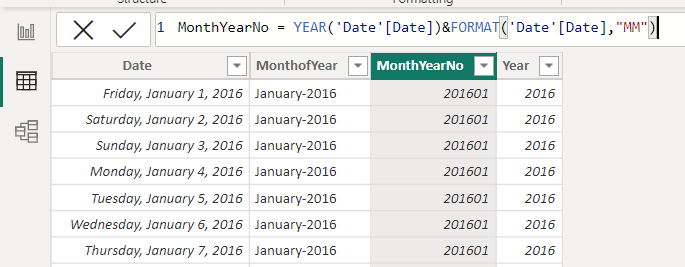
(1) Get the data in power BI desktop. Here I have Profit table and calendar table as shown below. Create the Month of Year, Month year no calculated columns in both date and Profit table.


MonthYearNo = YEAR(‘Date'[Date])&FORMAT(‘Date'[Date],”MM”)
MonthofYear = FORMAT(‘Date'[Date], “mmmm-yyyy”)
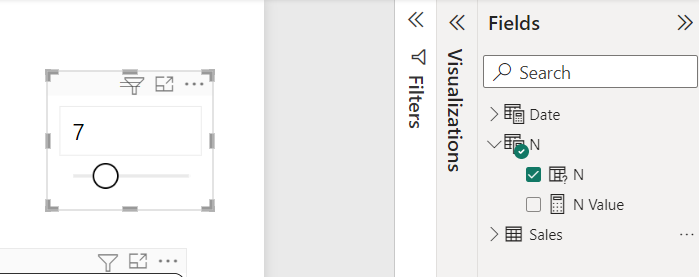
(2) The next step is to make a measure that will display the last N months. Let’s create a What If parameter called N with values from 1 to 24 and increments of 1. Place it in the chart as shown below

(3) Create the Measure that will display Profit for last N months.
N month Profit =
CALCULATE (
SUM (Profit[profit]),
DATESINPERIOD (‘Date'[Date], MAX (‘Date'[Date]), – [N Value], MONTH)
)
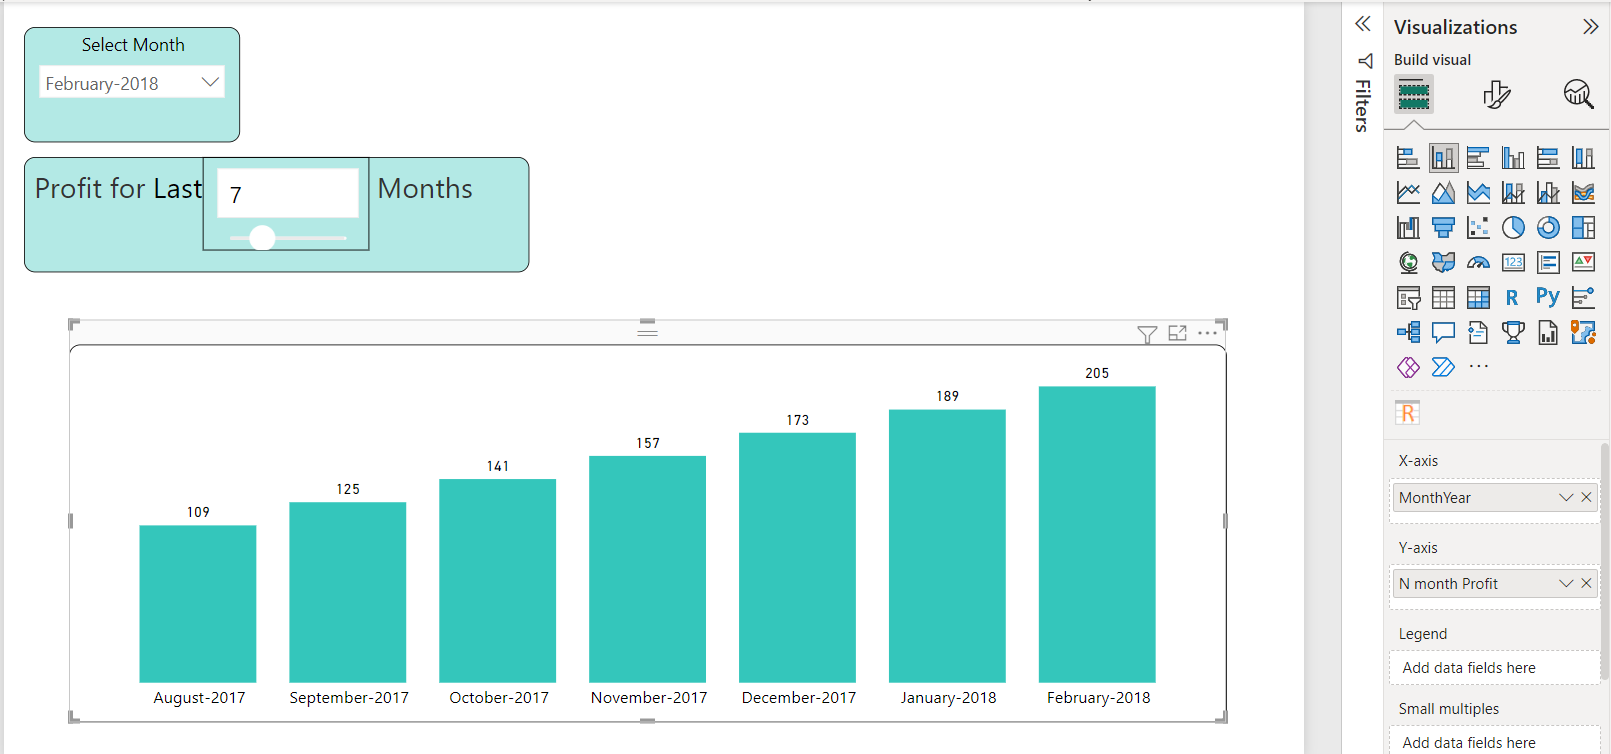
(4) No let’s dive into visualization part. Create a Bar Chart with Monthyear column from Profit table on X-Axis and N month Profit measure on Y-Axis. Similarly create slicer using month of year column from Date table.

Now you can change the month in the filter, as well as the value of N and see the bar chart change.
Happy Reading & Learning!!

