
Debugging is one of the most important and useful techniques that every developer needs to achieve while developing an application to properly navigate and find the bugs or errors in the application efficiently. React Developer Tool (React DevTools) is one of the debugging tools.
What is React DevTools?
React DevTools is a browser extension available for all browsers. It is designed to help you debug React applications in environments and allow us to inspect React Components Hierarchy in Chrome developer tools. While developing an application with React, it assists us by providing an extra set of React-specific inspection widgets.
We can directly install its browser extensions for all browsers else; we can use the below NPM command to install the extension
1. React Profiler for Debugging Performance of Application:
In React Profiler, by clicking on Start Profiling, capture all performance of the application concerning the time at Flamegraph chart (Flame graphs is distributed design that includes error and computing data to help developers identify and fix a blockage in their applications.). This feature provides us which component is rendering first on ranked bases, how much time is taken to load the component from parent to child, how components are distributed, which component is the parent of which child component, and how many times the component is rendering. Based on these, we can improve the performance of our application to make it fast.
For Example: In our folder structure, we have LedgerMain.js, which behaves as a parent component, and inside this parent component, we are calling three child components BankTable.js, CreditForm.js, and Debitform.js.

Now let’s check what performance analysis we will get when we check in React Profiler. Initially, it is in stop mode of recording we must start profiling.
2. Identifying Components Props and Context in Real-Time
In React DevTools Components feature, we can get all components in nested form (which component resides inside the parent component) with all its real-time rendered props, state, hooks, and functions, and rendered by component name. As we build the application, we will use React Developer Tools to explore each component’s current state and props.

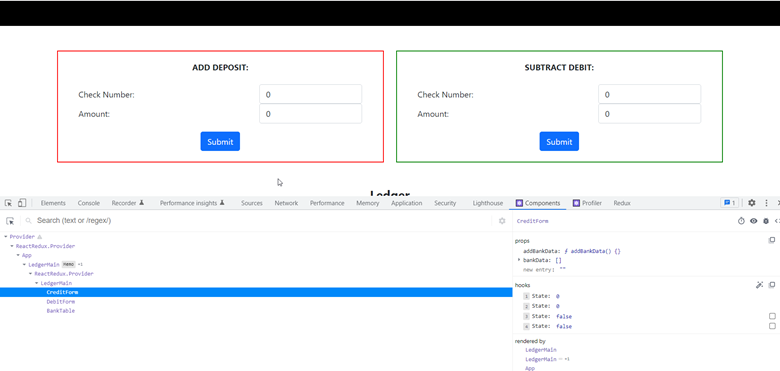
Fig. 2.1
As we type or change value in the input field, we can be able to see real-time data change for that state in React DevTools.
As you can see below, initially, for CreditForm Component, we had all states to their default state means we haven’t made any changes. Now we have changed the value in the input fields of the CreditForm Component, the state is updated as per the changes in the input fields
When submit button is clicked, at this time state of the input fields is empty, and the bankData array is now updating with the submitted values.
3. React Components and State Access by Using Console
As a developer, console.log is my favorite debugging way to fetch data. So, for this reason, React DevTools is my favorite debugging tool, which gives you a complete interaction facility to interact with components through the console.
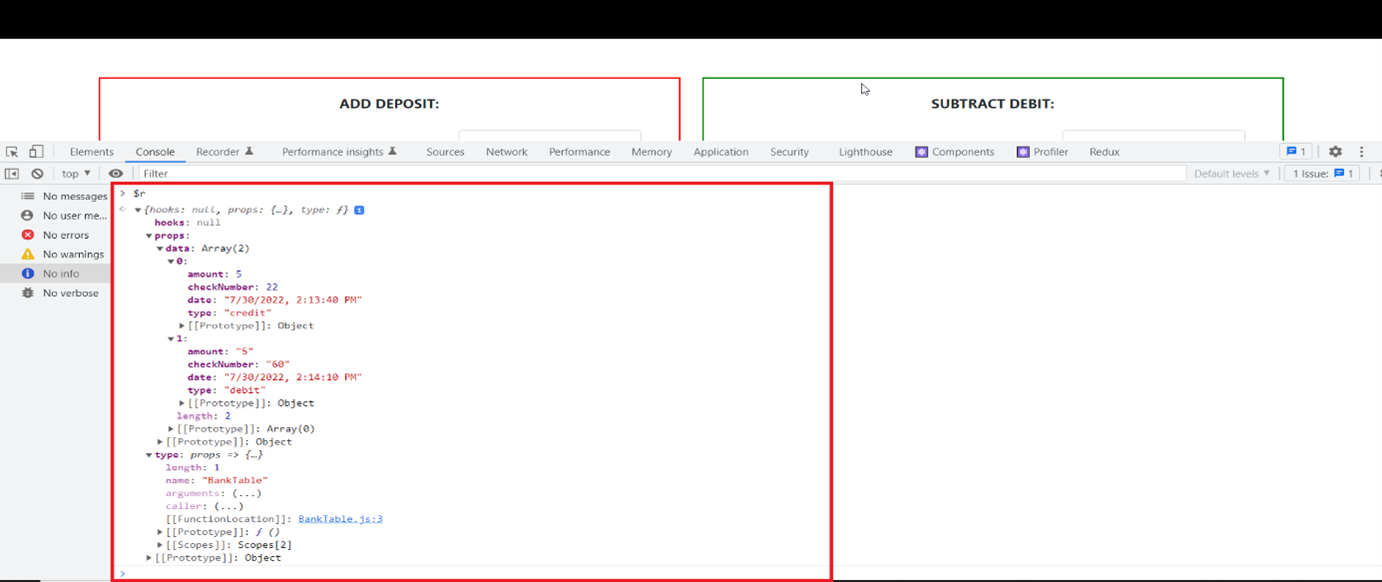
By typing ‘$r’ in the console tab you will get all hooks, states, and functions as well as trigger callback methods, and even augment functionality.
4. More Features with React DevTools

Fig.4.1
 Suspend the selected component if the component is within the Suspense <Suspense> components can be used to specify loading states when components deeper in the tree are waiting to render.
 It will inspect matching DOM elements and redirect to Elements pointing to that HTML element
 When we click on it log selected component data at the console
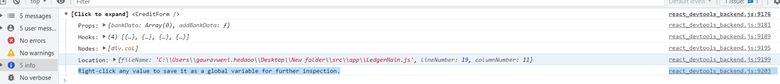
 When we click to view a selected component file in Sources
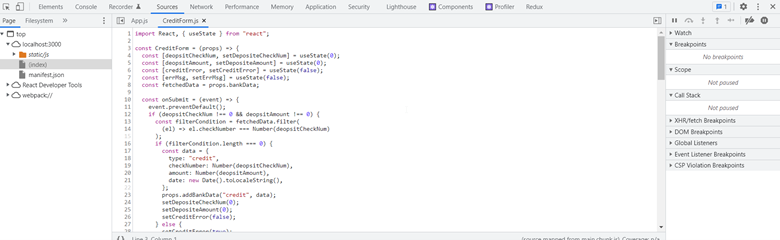
Conclusion:
As we can see in our above discussion React DevTools is a powerful browser extension that helps us to debug components by using real-time data. React DevTools provide the facility to interact with components, determine performance, and optimize them using Profiler. If the application is based on hooks, then debugging is faster with the help of React DevTools.