
Power BI Performance Tuning
Whenever we start developing reports in Power BI three important things always come to mind these are data accuracy, data security, and report performance. If the report performance is not up to the mark, then there is no meaning of how much effort we have put into it, we have to think of redevelopment or redesigning of the report for better performance.
There are some best practices that when implemented can lead us to better performance, let’s see them one by one-
1. Reducing the model size– Model size is correlated in the negative direction to model performance, thus smaller our data model is, the faster it will be. We can reduce our data model by following the steps-
- Removing unnecessary data– Instead of importing all the data, take only the data you need. Remove all the unnecessary or unused columns from a table and filter out the data which is not useful.
- Turn of auto Date\Time- When this option is enabled, this feature creates a date hierarchy for all the date column and automatically create a hidden table for all the Date type column in the model which will lead to a huge data size.
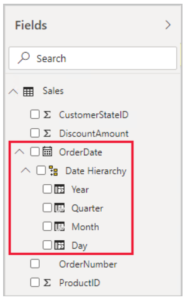
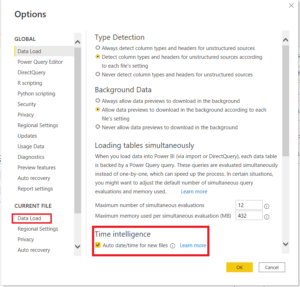
We can check and disable Auto Date/Time in power bi desktop go to File -> option & settings -> Options -> Data Load (Global & current File). From here you can enable or disable it.
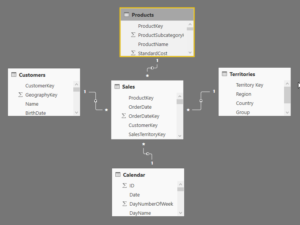
2. Model Designing– We usually create Star or Snowflake schema model in Power BI in which the Star schema model is the best design for Power BI reporting and gives you better performance than other models. Star schemas have a fact table and dimension table(which are connected to the fact table). It looks like as below
If we talk about the snowflake schema it is a further normalization of the dimension table to reduce redundant data and we create sub-dimension tables which are connected to the dimension table. It looks like as below

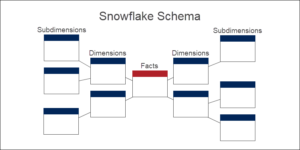
This model is more normalized than the Star schema model, but it gives less performance because it creates additional joins in queries for subdimension tables. So, the fewer joins we have in the model is better.
3. Report view – While creating a report there are some important points, we need to follow which will lead to better performance.
- Limit the number of visuals on the page or report, creating too many visuals on a page or report slows the performance.
- Removing unnecessary interaction between visuals will improve report performance. By default, on a report page, we have interaction between all visuals.
- Always use Power BI certified visuals in the report. It has better performance than custom visuals or third-party visuals.
- Using too many slicer visuals can reduce the performance of the report. Instead of using too many slicers in the report, we can use only the important ones and, can use filter pain based on requirements.
4. DAX – We can create both the Measure and calculated column using Dax, but it is important which one to use when because it is going to hamper report performance. We have to use Measure instead of calculated column whenever possible because the calculated column use space in the model and consumes both disk space and RAM which causes slow performance. On the other hand, measures are nothing but virtual formulas which don’t consume space, its only use calculation power.
- When to use Calculated column– If you want your new data to appear on ROWS, COLUMNS, or in FILTERS in a PivotTable, or on an AXIS, LEGEND, or, TILE BY in a Power View visualization, you must use a calculated column. Just like regular columns of data, calculated columns can be used as a field in any area, and if they are numeric, they can be aggregated in VALUES too.
- Use of Variables in measure can increase your measure performance also it reduces the complexity of measure and increases readability.
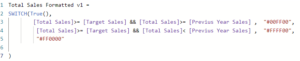
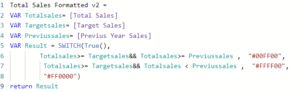
As you can see below I have created two measures, Total Sales Formatted v1 without variables and Total Sales Formatted v2 with variables. In v1 the total, target, and previous sales execute each time in a switch statement.
Whereas in v2 all the sales calculations are stored in a variables and we are reusing them in a switch statement. It will give better performance than v1 measure.
5. Cache update frequency- By default, the Power BI cache update frequency is set to one hour. Cache update frequency should be set at similar intervals to data source refresh frequency. If, for example, your data set refreshes only once per day, you should update the cache frequency accordingly. This improves report performance.
6. In a relationship tab we have to avoid bidirectional filtering because they introduce complex joins between the tables and affect background performance.
7. We can reduce the data loaded on a page by using Drill-through, bookmarks, and tooltip which reduce the page loading time.
8. Use Enterprise gateway instead of Personal gateway because it gives better performance. Personal gateway only support Import mode, whereas Enterprise gateway support both Direct Query and Import mode. It is recommended to use an enterprise gateway while working with a large dataset.
These are some of the best practices which are recommended and can be implemented to improve the performance.
Hey Novil, nice blog man!
The way you explained the importance of reporting in a better way, is impressive. I got value addition from your post.
I do post regularly on Power BI topic. If you are interested, please check here- https://www.integrativesystems.com/microsoft-power-bi-support/ .
Thanks.
Thank You Abel
Hey Novil, it was worth reading got new factors to learn which could affect performance tuning.
thanks for sharing.