
The truth is that being an analyst is all about balancing quality versus speed. This manifests itself in finding good tools which help make you more efficient. If there is one thing that analysts all agree upon, it is that no single tool does everything great. One piece of my advice to analysts is to start a collection of online bookmarks.
Here are the Top 7 bookmarks that every analyst should have. Some are useful on a daily basis, and others are situational and rarely used. However, you’ll probably need them someday, and when you do — it’ll save you a lot of time.
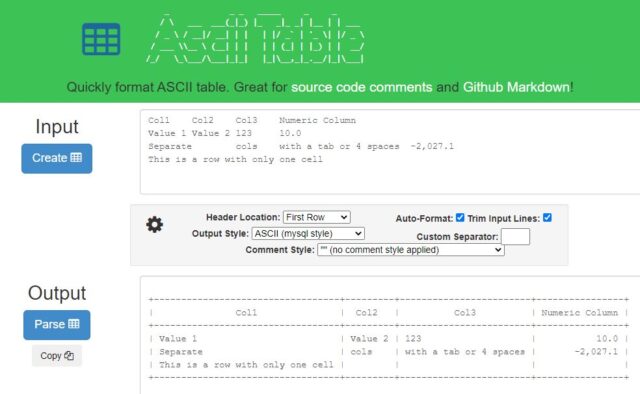
#7 Ascii Table Formatter
A table formatter lets you convert a block of copy/pasted data into a much more efficient and aesthetically pleasing format. This comes in handy in a variety of different ways.
Ascii Table Formatter will automatically convert the text without having to click anything; it is instant!
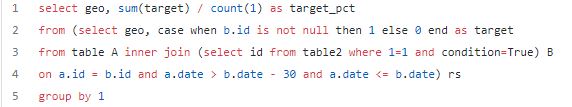
#6 SQL Beautifier
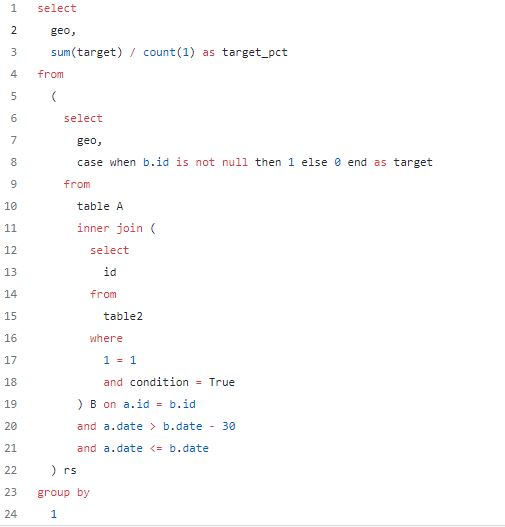
When simplifying SQL Code, try using SQL Beautifier.
Normal Code
Formatted Code
#5 JSON Viewers and Converters

Want to quickly browse a JSON structure to see what elements are available? Need to debug why your parsing script is failing? Then I recommend checking out:
- To convert JSON to CSV- https://www.convertcsv.com/json-to-csv.htm
- To convert CSV to JSON- https://www.convertcsv.com/csv-to-json.htm
- To parse and view- http://jsonviewer.stack.hu/
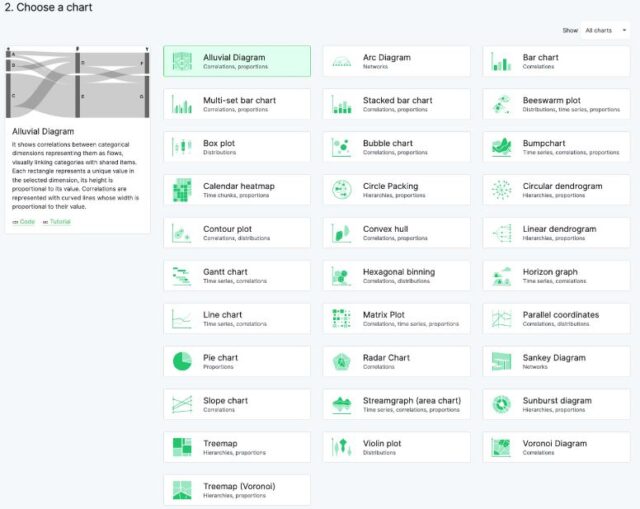
#4 Graph Builders
There are plenty of online resources for building quick graphs, but RAWGraphs 2.0 is my favorite. I like it because it has a wide range of lesser-known chart types (like Calendar heatmap and Circle Packing) that otherwise take too long to figure out in Excel.
.
#3 SQL Generator
A SQL Generator is basically a template for a SQL query, which lets you customize column names and table structure, choose the operation you want to do, and then construct the syntax for you in various “flavors” of SQL.
Never worry about the subtle differences between DATEDIFF() vs. DATE_DIFF()again! My personal recommendation is Rasgo.
#2 Color Picker for Reports
For picking color code, I use the W3 HTML Color Picker. It has a wide range of colors and color combinations.
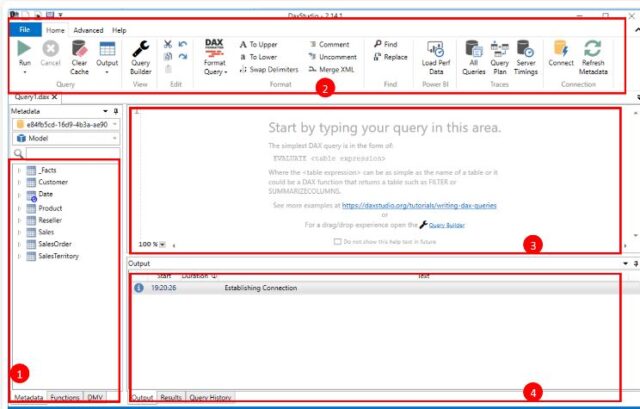
#1 Dax Studio
DAX Studio is a tool to write, execute, and analyze DAX queries in Power BI Designer, Power Pivot for Excel, and Analysis Services Tabular.
It includes an Object Browser, query editing and execution, formula and measure editing, syntax highlighting and formatting, integrated tracing, and query execution breakdowns.
Conclusion
The truth is that being an analyst is all about balancing quality versus speed. A toolkit that helps you cut corners without sacrificing quality is a way to improve your effectiveness.
Thank you for reading.