
Introduction:
Power BI’s merging and appending operations allow you to join data from multiple tables.
The choice between the merge and append queries depends upon the type of concatenation you want to carry out based on your requirement.
- When you have one or more columns that you’d like to add to another query, then you use merge the queries option.
- When you have additional rows of data that you’d like to add to an existing query, you append the query.
Merge operations:
- Merge operations join multiple datasets or tables horizontally based on standard criteria (common column) between the tables.
- This means that data is added to the matching rows in the base or first table from the second and subsequent tables.
- If you select the default merge operation, your base or primary table will have the same number of rows at the end of the process as it did at the start, but each row will contain a new column or new columns.
- However, this will not be the case if you choose a different type of Merge. The default merge operates the same way as a left outer join in SQL.
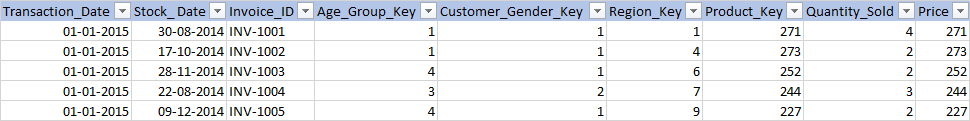
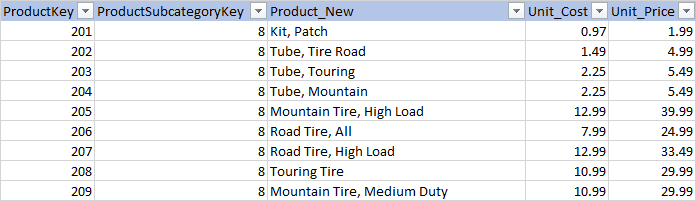
Let’s consider we have two tables one is the Sales Data, and the other is the Product Data as below:
Sales Data:
Product Data:
Steps to follow for Merging the queries: –
- From the left pane of Power Query Editor, select the query (table) into which you want the other query (table) to merge. In this case, it’s Sales Data.
- Click on Sales Data Table. Click on Home Tab in the Ribbon Menu.
- Click on Merge in the Combine section.
- Click on Merge Queries as New.

A pop-up menu appears.
- From the first drop-down menu, select Sales Data and click on Product_Key (common column between Sales and Product table)
- From the second drop-down menu, select Product Data and click on Product_Key.
- Click OK.
On ‘Merge Queries,’ you will get two options, ‘ Merge Queries’ and ‘Merge Queries as New.’
Merge Queries:
This option is used to merge two tables and does not create a new table.
Merge Queries as New:
This option is required to merge two or more tables and create a new one. You need to click on ‘Merge Queries as New’ to create a new one.
- On the merge screen, we can select the two tables from the drop-down list and then select the column or columns (we can even select multiple columns to join upon), which will be joined together.
- In the below example, we are using Product_Key from the Sales Data table and Product_Key from the Product Data table.
- As you can see in the below image, the Join Kind defaults to a left outer join, meaning all rows from the 1st table (Sales Data) will be joined with the matching rows from the 2nd (Product Data) table.
- Note that the join finds a match between 1,63,072 of the rows in each table.

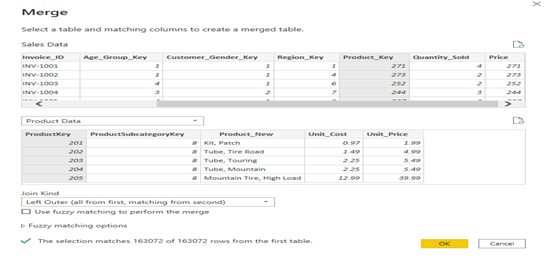
There are 6 different types of joins, including right and left outer joins, full outer join, inner join, and left and right anti joins. Anti joins find rows that do not match between the two query datasets.

The result of the Merge is shown below. A new column is added to the Sales Data dataset with a column name matching the 2nd table name, Product Data, in the below example. The data are just listed as “Table,” which can be confusing.
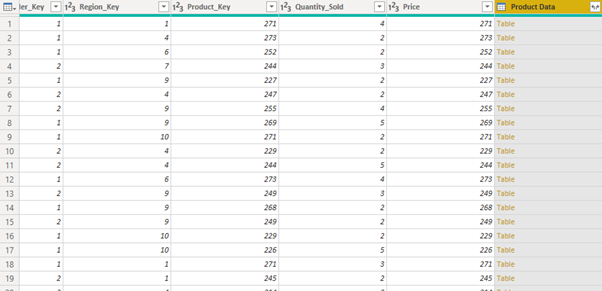
- To see the related columns on the right-side column of the join, this column needs to be expanded using the double arrow button in the right corner of the column header.
- Clicking on this button opens a window that allows for selecting specific columns from the second table that should be included in the merged dataset.
- Checking the use of original column name as prefix can be checked to on or off which prefixes the table name to each column.
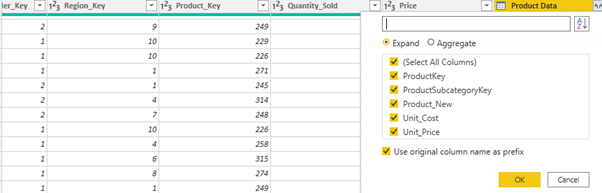
- Expanding the column adds the selected field from the right-side table to the merged dataset.
Fuzzy Match Option:
- We can expand the reach of the Merge function by using the fuzzy match option.
- It will increase the match count upon using the fuzzy matching option. The similarity threshold ranges from 0 to 1. Default 0 would generally mean match every row (a full outer join in SQL), whereas 1.00 would equate to match on exact matches (an inner join in SQL).

- The match by combining text parts option will look at combining two text values to find the matching join. The combing could be items such as left-side vs. left-side, part-of vs. part of, for example.
Append operations:
- Append operations join two or more tables vertically.
- The data rows from one table are appended (or added) at the end of the data rows in another table where the column values match.
- So, in an append operation, the base table will have the same number of columns at the end of the processes as it did at the start, but each column will contain more rows.
- Append means the results of two (or more) queries (which are tables themselves) will be combined into one query in this way:
- Rows will be appended one after the other. (For example, appending a query with 150 rows with another query with 250 rows will return a result set of 400 rows)
- Columns will be the same number of columns for each query*. (For example, column1, column2…column7 in the first query, after appending with the same columns in the second query, will result in one query with a single set of column1, column2…column7)
Consider two sample data sets: one for Sales-2019:

and Sales-2020:

Steps to follow for Appending the queries: –
- From the left pane of Power Query Editor, select the query (table) into which you want the other query (table) to append. In this case, it’s Sales Data.
- Click on Sales Data Table. Click on Home Tab in the Ribbon Menu.
- Click on Append Queries in the Combine section.
- Click on Append Queries as New.
A pop-up menu appears.
- From the first drop-down menu, select Sales-2019
- From the second drop-down menu, select Sales-2020.
- Click OK.

- If you want to keep the existing query result as it is and create a new query with the appended result, choose Append Queries as New. Otherwise, just select Append Queries.
- In this example, I’ll do Append Queries as New because I want to keep existing queries intact.
You can choose what is the primary table (typically, this is the query that you have selected before clicking on Append Queries) and the table to append
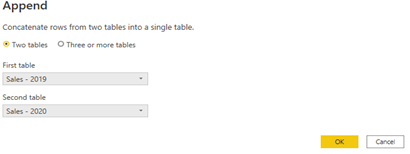
- You can also choose to append Three or more tables and add tables to the list as you wish.
- For this example, I have only two tables, so I’ll continue with the above configuration.
- Append Queries simply append rows after each other, and because column names are exactly similar in both queries, the result set will have the same columns.
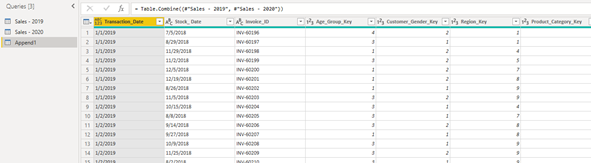
Append is like UNION ALL in SQL.
How Append Query handles the duplicate values?
Append queries will NOT remove duplicates; we must have to use Group by or remove duplicate rows to get rid of duplicates.
What if the columns do not match between the two source tables?
If columns in source queries are different, append still works, but it will create one column in the output per each new column. If one of the sources doesn’t have that column, the cell value of that column for those rows will be null. However, Append requires columns to be precisely like work in the best condition.
Conclusion
Power BI merge and append queries are very handy for concatenating data from multiple questions or tables when preparing your data for visualization.
The fuzzy matching feature makes merge queries even more powerful, allowing the combination of two tables based on partial matches.
Very Informative blog.
Hi Ajay, Informative blog & very well articulated. Thank you for writing.
Thanks Arpit
Thanks Ketan
Well explained. Nice One.
Well explained on a very critical functionality of Power BI. Thank you Ajay.
Thanks Ajay for the clear explanation between the Merge and Append! It really helps me to understand easily which function I should use for my project, appreciate your sharing 🙂
Very clear explanation. Thanks