
Paginated Reports are the same as SSRS, which have come to Power BI with advanced features for better reports. Paginated Reports are well designed & formatted reports which are perfectly sized so we can print and share the reports effectively. We can also load images and charts on these reports. We can create highly formatted reports for PDF generation purposes.
Power BI Report Builder is a tool used to create Paginated Reports and have them published on Power BI Service. We need Power BI Premium Capacity for Power BI Paginated Reports.
How to Create the Paginated Report
Following are the simple steps to create a Paginated Report using Power BI Report Builder:
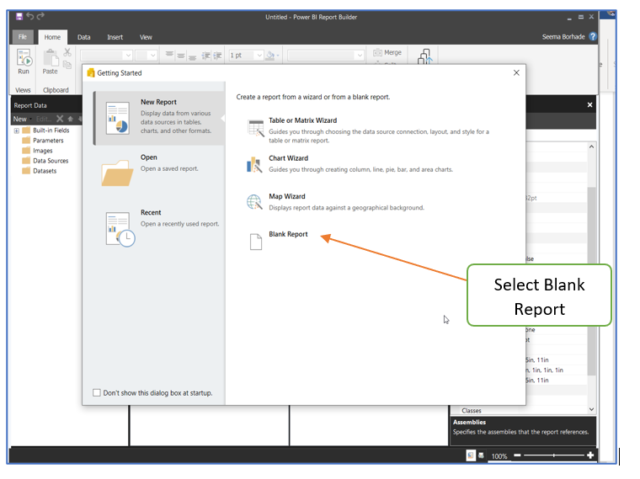
1. Open Power BI Report Builder:
First, we need to open Power BI Report Builder; you will see the below window. In this one, we can select Table Wizard/ Chart wizard/ Map Wizard / Blank Report. Here we will select Blank Report.
2. Create and Configure Data Source:
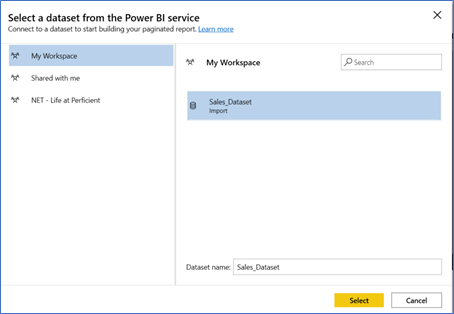
After selecting the Blank report, Create the Data source to connect with Dataset you have already created and published in the workspace: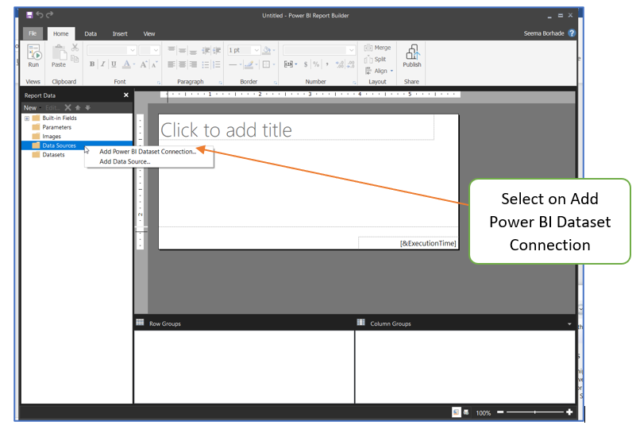 Select the Power BI dataset available and create the Data source connection (Select the highlighted one Dataset):
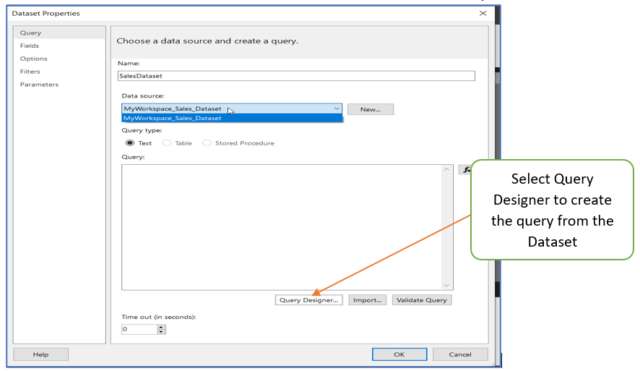
3. Create a Dataset for the Report:
After creating the Data source, we need to make the Dataset for the report. When you click on Add Dataset, the below Dataset Properties Window appears; here, we will give the appropriate name to the Dataset and select the Data source we have already created.
Now we need to select the columns for the design view and also get the parameters in the parameters pane:
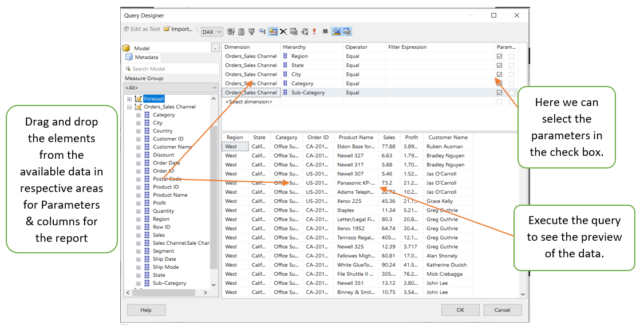
Now Click on Ok, and you will see the query created in the Query Designer. Again, click on Ok, and we can go ahead to make the table on the Report Page.
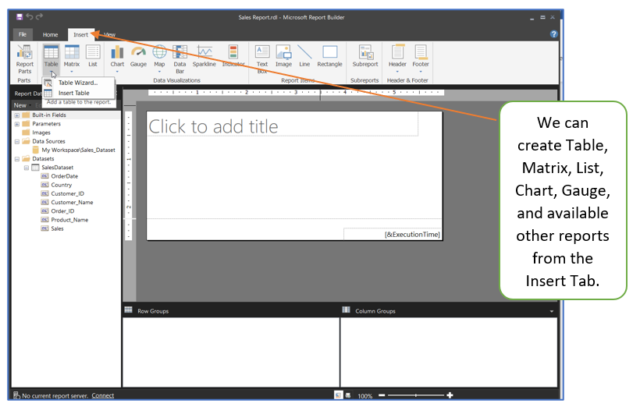
4. Create the Paginated Report:
Lets’ create the table from the Table Wizard:
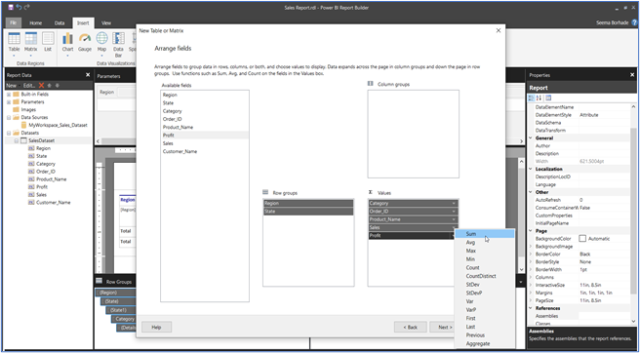
After clicking on Table Wizard, you will see the window to choose the Dataset which already exists or the one you have already created before this step. After selecting the existing Dataset, the next step will be the Arrange Fields. In this, we need to drag the columns for Value, Row group, and Column Group pane as below. Also, we need to summarize the metrics as shown in the below image:
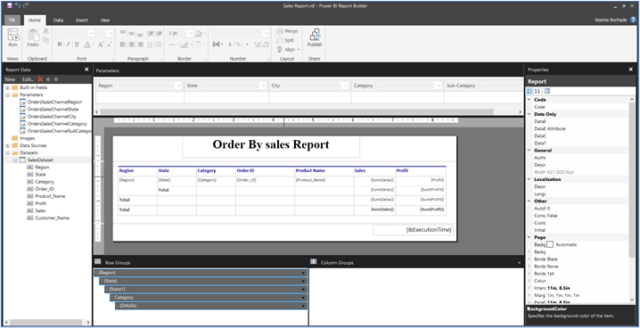
Click on Next and Finish, and the table will be created on the Report Page. Then you can do some formatting as per the Client’s Requirement to get the final Report. We can use Properties for formatting purposes.
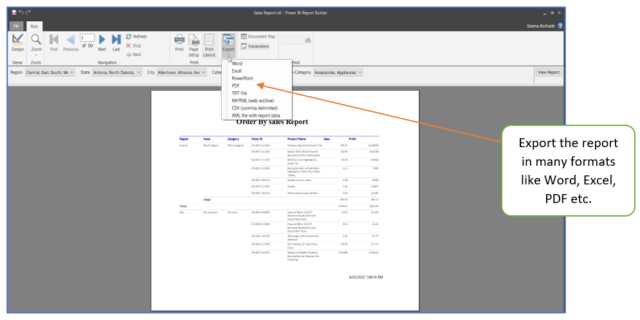
5. Output of the Paginated Report:
To see the output of the report, we need to “Run” the Report from the “Home Tab.”
Paginated Report is always saved in .rdl file format.
After publishing the report on the Workspace/Power BI Service, the user can view the report on the Power BI Service. Users can view or download the Report from the Power BI Service also.
Why Use Paginated Reports?
- Paginated reports help create tabular reports, purchases, sales invoices, etc.
- Paginated Reports are more customized and cascading parametrization.
- Includes graphic Query Designer to write the queries and test for the same.
- Optimized for printing or PDF generation.
very Good and useful.
Thank you Prashant sir!!
Nice Blog
Thank You Ketan!!
hi, Seema Borhade, can I ask a question?
that is How to add the achievement rate indicator, divide(act, target), I don’t know how to do it, can you answer me? thanks a lot
Hi Jackson,
Please find the below link for the indicator in Paginated Reports:
https://docs.microsoft.com/en-us/sql/reporting-services/report-design/indicators-report-builder-and-ssrs?view=sql-server-ver16
Thanks!!