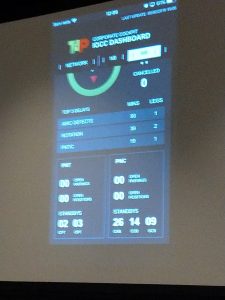
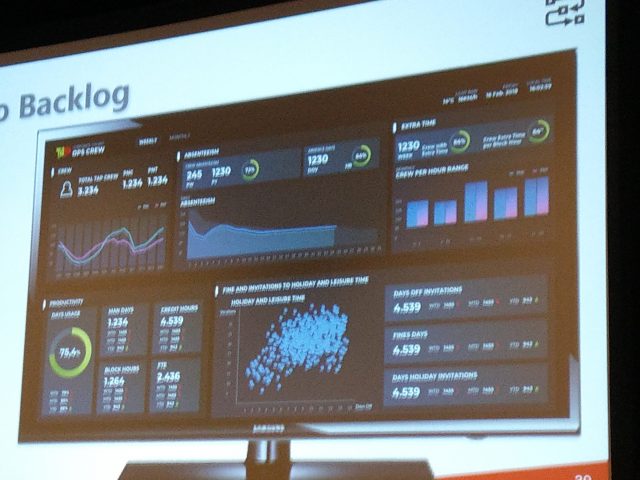
Rui Monteiro presented on how TAP Air Portugal is using MicroStrategy and embedding insight throughout the organization.
The final result: the OCC dashboard. TAP is on a growth curve. They are purchasing 40 new planes and need to get all the data on the entire network in real time and throughout the day.
Challenge
Show key network data on aircraft, maintenance, and other statistics. Data cuts across operations, customer, commercial, and maintenance divisions. Their datawarehouse has 18TB of storage with 87 source systems. In addition to that, TAP needed to combine it with real time data not in the datawarehouse.
Further challenge is that IT needed to engage technology, people, and processes where the end users hadn’t achieved a full buy-in. They needed to deliver real time data but in a data-driven culture
How
First, they started with strategy and focused on product and architecture in their strategic roadmap. They adhered to a key philosophy of fostering agility in their team.
Agile Architecture
Start with the data. Focus on
- Data sources
- Data acquisition
- Data curation
- Data provisioning
New Data: they had aircraft and airport data not pushed into the data warehouse. The warehouse itself pulls in about 500K record per day.
Had to modify the EDW heavy architecture to include this new real time data. They store all the data in a data lake that now has over 10TB of data in 6 months. This is an enhancement rather than a replacement to the data warehouse
 Note: Using azure for the data lake and analytics sandbox
The data in the data lake includes structured and unstructured data.
Agile: The addition of the data lake makes them more agile. They can more easily include social media, service, sensor, and other data. They have a prototyping zone that allows them to pull and transform the data.
People: TAP incorporated product management resoruces along with architecture, analytics, and even a “wrangler” team. They included key roles:
- Data Modeler
- Data Engineer
- BI Analyst
- Data Scientist
These roles were built into the team and inserted in the processes they had defined. Data Modeler and BI Analyst roles work together to define new insights and reports for the business. One focuses on the IT side, the other on the business needs.
Product: Centralized the portal and data catalog. Wanted one source of the truth.
This analytics portfolio includes the data hub but is mobile based, web based, and TV based.
Process for each request
- Understand the request
- Include user experience and IT teams
- Create a dashboard that is the right “experience” Note the use of the word experience here. I think it’s a correct approach and the right term.
Dashboards follow a common style guide. Each dashboard pulls data from a range of sources like the new persistent layer, the EDW, and a weather api.
TV: started with three, now have 15 and will push out 10 more.
Web: Everything is available via web. Many with the ability to drill down into each KPI
Mobile: Mobile is a key. User can access from their phones and tablet
Evolution
TAP continue to evolve the solution. Dashboards have changed a few times. The current generation dashboards are more information dense and color coded to allow for easier transmission of information

Real time example: was able to tie sales of ticket to/from Brazil and see the impact from the latest election.
