In a previous blog post we covered the steps necessary to host a static website within AWS, more specifically how to deploy a custom agent console that can load in contact attributes. Today we will look at how we can use the Connect API to enhance this custom agent console with live data from the call center. In this use case we will offer agents a quick snapshot of how many calls are waiting in queue and how many other agents are available to help with those calls. However, the same steps detailed below can be used to build a standalone wallboard that doesn’t offer call controls.
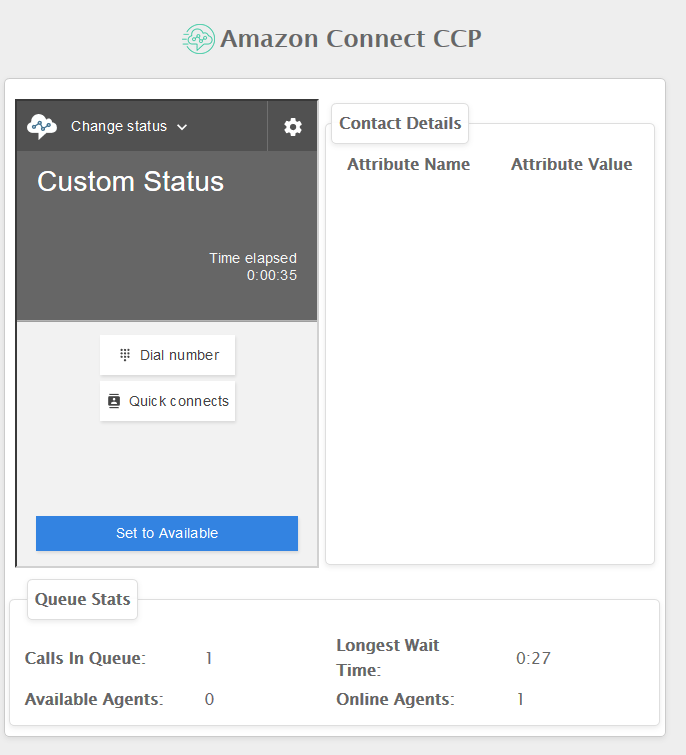
Our proof of concept will pull in the number of calls in queue, longest wait time and agent details for all the queues in our environment then display the data on the agent console every 5 seconds. To do this we will use the newly released GetCurrentMetricData operation, which Peter Miller explored in more depth within this blog post. The final console will look like this screenshot.
We will deploy and configure the following resources:
- A Lambda function to query the API for metrics
- An API Gateway allowing external access to the Lambda function
- An enhanced agent console that will periodically request data from our API Gateway
Please note that while our example can work for a small call center it means every agent’s console will end up hitting the Connect API. In production it’s recommended to deploy a Lambda function that periodically updates a DynamoDB table and potentially even aggregates data based on routing profile, so each agent can see only data relevant to their queues. Also, please note that we will not be covering security best practices, in production your API gateway should be secured to prevent unwanted access to your call center metrics.
Configuring Lambda
To start off create a new function inside your AWS console and name it appropriately. We will use asynchronous functions to pull in data so select Node.js 8.10 as the run time and finally select an appropriate role or create a custom one if needed.

The Lambda function we will build will be invoked by the API gateway and at a minimum it should have “connect:GetCurrentMetricData” permissions for the instance of Connect you want to use. For more details on how to set up the role for this Lambda function check out the example at the bottom of this page.
In my environment I used the following, very permissive, policy to grant Lambda access to all my Connect instances.
{
       "Version": "2012-10-17",
       "Statement": [
         {
           "Sid": "VisualEditor0",
           "Effect": "Allow",
           "Action": [
             "connect:GetCurrentMetricData",
             "logs:CreateLogStream",
             "logs:CreateLogGroup",
             "logs:PutLogEvents"
           ],
           "Resource": "*"
         }
       ]
     }
Once all basic settings are configured create the function and add two environmental variables which will contain your Connect instanceID and your queueID’s. Here is how this looked in my environment.
The instanceID will accept only one ID, which can be found at the end of your Amazon Connect instance ARN, while the queueID will accept as many queues as you want to pass in as long as they are separated by a comma. You can find the queue ID, by looking at the URL of each queue inside of Amazon Connect. Note that our code will aggregate all the queues and offer 1 total, if you want to return the data grouped by queue make use of the Groupings parameter when invoking the Connect API.
You can leave all other settings as default and start working on the actual code.
Please note: As of October 24th, the AWS SDK package available by default inside Lambda does not yet contain the getCurrentMetricData method. Until this is resolved you will most likely encounter a “TypeError: connect.getCurrentMetricData is not a function” error if you use the standard “require(‘aws-sdk’)”. To get around this temporary limitation you can build your own AWS SDK package using these instructions.
After grabbing the AWS SDK package, you can simply use the code below in an index.js file and upload a zip file of the entire deployment to Lambda. For more details on how to upload a deployment package check out the official documentation.
const AWS = require('./aws-sdk');
AWS.config.update({ region: 'us-east-1' });


function getCurrentData(){
   const params = {
          CurrentMetrics: [
            {
              Name: 'AGENTS_AVAILABLE',
              Unit: 'COUNT'
            },
            {
              Name: 'AGENTS_ONLINE',
              Unit: 'COUNT'
            },
              {
              Name: 'CONTACTS_IN_QUEUE',
              Unit: 'COUNT'
            },
              {
              Name: 'OLDEST_CONTACT_AGE',
              Unit: 'SECONDS'
            }
          ],
          Filters: {
            Channels: [
              'VOICE'
            ],
            Queues: process.env['queueID'].split(','),
          },
          InstanceId: process.env['instanceID']
        };
    const connect = new AWS.Connect();

    return new Promise(function(resolve, reject) {
    connect.getCurrentMetricData(params, function(err, data) {
        if (err) return reject(err);
      resolve(data);
    });
  });

}

exports.handler = async (event, context, callback) => {
    let responseBody={};
        try{
            console.log('Running getCurrentMetric function');

            let dataTransit =  getCurrentData();
            let data = await dataTransit;
            console.log(data.MetricResults[0]);
            data.MetricResults[0].Collections.forEach(function(element) {
                  const key = element.Metric.Name;
                  const value = element.Value;
                  responseBody[key] = value;
                    });
              console.log('Building response to send over ')
              console.log(responseBody);

              let responseCode = 200;
              let response = {
                  statusCode: responseCode,
                  headers: { "Access-Control-Allow-Origin" : "*"},
                  body: JSON.stringify(responseBody)
              };
            callback(null, response);
        }
          catch(error){
            console.log(error);
            let responseCode = 500;
            let response = {
                  statusCode: responseCode,
                  headers: { "Access-Control-Allow-Origin" : "*"},
                  body: JSON.stringify(error)
              };
            callback(null, response);
          }
}
A few things to note about this function: We are only asking the Connect API for 4 values: Available Agents, Agents Online, Contacts in Queue and the Oldest Contact Age. The data returned will be a total for all queues, not grouped and the response is configured so the API gateway can parse it and our website can load the data. If we don’t add the Access-Control-Allow-Origin to our header we will encounter a CORS problem (Cross-Origin Request Blocked: The Same Origin Policy disallows reading the remote resource at…) . Please Note: right now the header is set to accept request from any website, you should change this to limit access to just your domain.
Once the function is uploaded we are ready to configure the API Gateway.
API Gateway
Navigate to the API Gateway section of your AWS console and create a new API. Name it something appropriate like connectMetricsAPI and hit save, then add a new GET method.
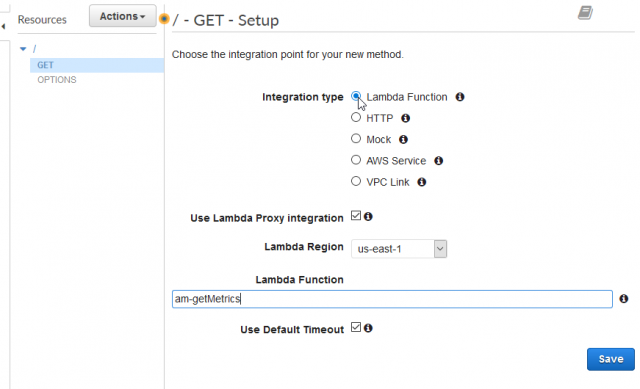
Under integration type select Lambda Function and check the Lambda Proxy integration box. This option will make configuring the integration between Lambda and API Gateway easier and it will allow us to pull in the API response without too many configuration changes. For a full breakdown of the differences between using a regular Lambda integration as opposed to Lambda Proxy please review this article.
Enter the name of your previously created Lambda and hit save. The API Gateway will add the necessary policy to your function, so it can be invoked.
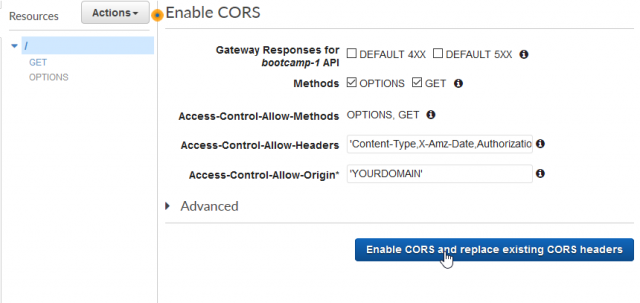
Once saved select Enable CORS under Actions and leave all the default settings except the Access-Control-Allow-Origin. In this box add the domain for your agent console.
Finally, deploy the API to a new stage from the Actions menu. You can name the stage anything that makes sense for your environment (for example “UAT” or “production” for the final version). This will generate an invoke URL you can use to test the response from your Lambda function. You should see something like the JSON below.
At this point our AWS services are configured and we can look at the new agent console code.
Custom Agent Console
The agent console we will deploy will use the Streams API to serve the CCP to agents for call controls, but will also pull in contact attributes and metrics. We will reuse much of the code from this blog post, but I added a new container for the metrics and made some changes to the script. You can download the final version of the page from this github repository.
If you download the code and want to test it, make sure you update the ccpUrl and the metricAPI inside the script.js file.
The main difference from the previous agent console is the getCurrentMetrics function which simply performs a GET XMLHttpRequest on our API gateway, parses the data and calls a function to update our HTML table with new numbers.
I also added a small function to convert milliseconds to minutes and seconds since the OLDEST_CONTACT_AGE will not return a nicely formatted timer.
Something to keep in mind when testing this agent console is that the getCurrentMetrics function is set to run every 5 seconds, depending on where it is in the run cycle and when a new call entered the system you might see up to 10 seconds of delay in the data. This is particularly noticeable when there is only one call in queue so the oldest contact age increments the longer they wait for an agent.
When testing, if you have only one call in queue, you will also see the metrics for contacts in queue or oldest contact age go to 0 when the call is offered to an agent. The call is essentially no longer in queue until the agent rejects it or misses it, then the metrics will jump back once the call is waiting in queue once more.
Finally, if you’re seeing odd numbers for the metrics, make sure you don’t have an at capacity path set for your queues or some other logic that can route callers in queues your Lambda function is not returning data for. Using GetCurrentMetricData on the Connect API you should get numbers that match pretty closely the results from the real time reports available out of the box. If in doubt check the reports and compare the numbers with the data in your agent console.
Finally, to actually deploy the custom agent console, please follow the steps in this blog post, create an S3 bucket and a CloudFront distribution. Once the webpage is uploaded in S3 and the CloudFront distribution is created you should be ready to test the new agent console.
For help customizing your console or assistance designing your call flows please email Craig Reishus.


