Del Clark, Dave Granholm, and Stefan Schmitz spoke on the future of analytics:
When information is delivered in the context of a key business role or process, there is immediate understanding. However, it’s more than contextual information—it’s about key performance indicators to manage performance, exploring drivers of performance, and leveraging machine learning to enhance your understanding that leads to timely action for optimal impact. In this session learn about Oracle’s strategy, products, and plans for next-generation analytics applications based on Oracle’s SaaS application suite, as well as where these applications are headed in the future.
I love the keywords here of context and understanding. Really, we all want the ability to use this data and not just in a reporting portal.
Analytics Apps Strategy
Statistic: There is a $430 billion advantage to organizations who use all data (IDC).
This has to be led by executives. They need the data and they need to instill a data led culture.
Statistic: 74% of enterprises say they want to be data driven but only 29% say they achieve that. (Forrester)
To lead by example, you need apps that allow exec to:
- Monitor the analytics
- Align
- Execute

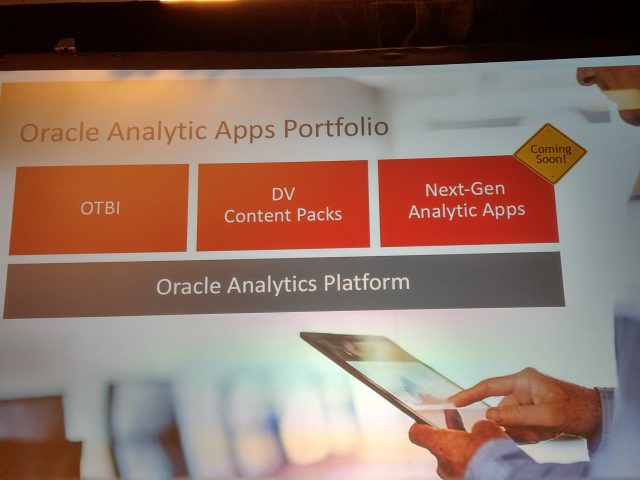
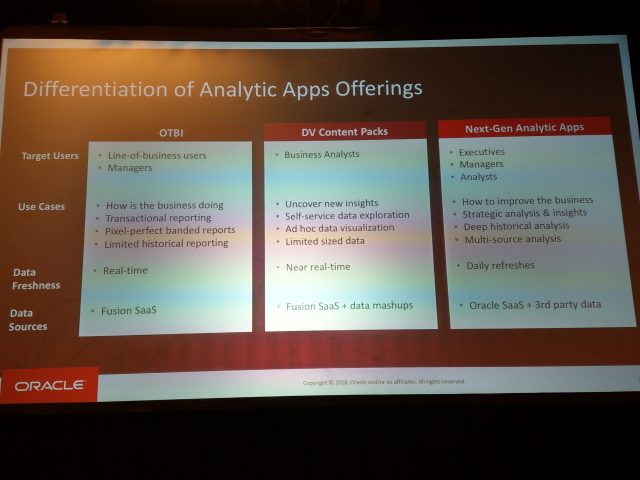
For the existing tools, they are “content complete” In other words, no new functionality will be added besides support for some core platform serfices. This includes:
- 11.11.1.10.3 is planned within 12 months
- oracle BI EE 12c
- Oracle Data inegrator
- Oracle BI Configuration Manager
- Support will be extended by two additional years
Apps in development
Near and Mid Term
- Pillar and domain speciic apps
- for broad set of use cases
- Focus on advanced reporting
- Superior consumption of insights (e.g. more modern and usable user experience)
- Modern
- Focus on awareness and understanding
- Apps
- Financials
- App fo rSCM
- for HCM
- for Sales
- For Services
Future
Higher Value analytics apps
- Designed for specific personae and targeted use cases
- Focus on predictive and prescriptive insights
Pervasive and Collaborative
- Bi-directional app integration
- Transaction to analytics app and vice-versa. More contextual
- Designed for collaboration and taking action
Leverage network effects of data
- Create more accurate and reliable predictive models
Apps
- Procurement spending optimization app
- supply chain risk analytics app
- Adverse Impact Analysis app
- Quality of hire analytics app
- Incentive Comp what-if analysis app
- Note how this will become more predictive and prescriptive

Need for Executive Analytics
Inspirage CFO Def Clark spoke about what he needs to do with the data.
Quote: “The only constant about our business is that it’s changing.”
Quote: “Running our business on the cloud has given us a wealth of data but it’s not exactly at our fingertips…”
have data in many places
- Client
- Competition
- Staff
- Traditional ERP
So what are our key requirements?
- This has to be real time.
- It has to delivered automatically to the people that need it.
- Drill down capable
- User customizable. We make the changes and not IT
- Dynamic prioritization
- Mobile device appropriate
Keep in mind that we need more than just reporting. We want to see data that represent true analytics. In other words, it’s interactive, cross-functional, and predictive.
Quote: Any enterprise is built by wise planning, becomes strong through common sense, and profits by keeping abreast of the facts
Product Preview of next-Gen Analytics Apps
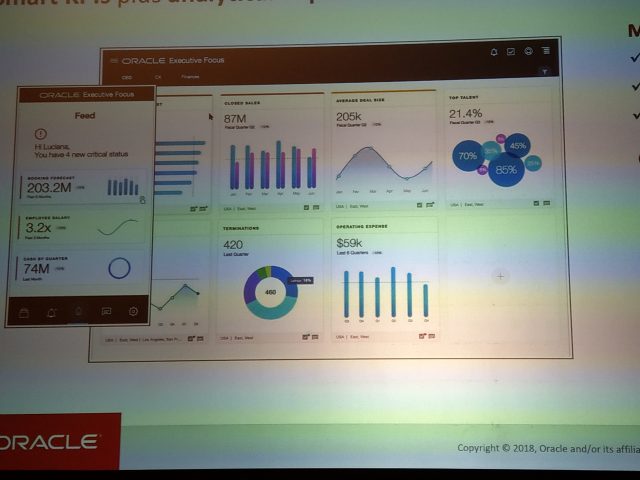
The new experience is specifically designed with decision makers in mind. Smart KPIs are in mind. It’s about drive collaboration and take actions.

Over time, this experience will leverage more predictive and prescriptive analytics capabilities. Let the system tell you when it has enough data. The entire experience is designed to be very personalized. each exec should be able to create his or her thresholds.
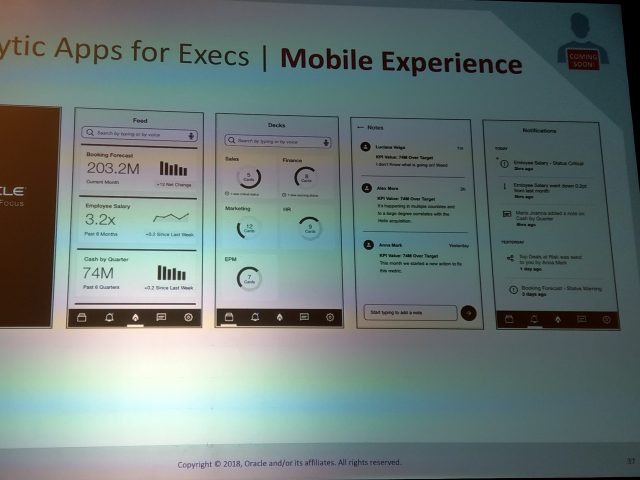
Mobile is also very important.

Demo
- Started with a mobile use case
- Company called Ativo which is a product company building exercise bikes
- Industry moving towards wearables which means brand new products
- The First experience is the CEO mobile dashboard
- earnings per share, revenue, retention, etc.
- Any KPI has the ability to start a discussion thread
- Easy to post the data to a discussion
- CHRO sees the update from the CEO and also sees a generated alert regarding retention
- Note that this dashboard contains role specific decks / KPI’s
- Can drill down into retention
- which shows retention by job type and compares it to goal and an industry benchmark
- Starts a chat regarding one KPI
- the HR team is already talking about it
- One analyst is already digging deeper into the data to look for cause
- At work, has a more detailed view available on the desktop
- Still role specific to HR
- Large card is the same KPI but with more details around it
- KPI details
- notes
- Tasks
- Related KPI like retention by performance
- Can drill into retention by high potential
- The best performers are not hanging around
- Meanwhile the analyst has come back with some things
- three new visualizations
- One which highlights that the high performers are below standard compensation
- Highlights where the talent skills gap exists
- Adds a note to the retention KPI for the exec team
- Asks CEO to revisit compensation with the board
- Reaches out to key departments and notes that new training funds are available
- Goes back to the retention KPI and adds a threshold

