
Data & Intelligence

TM1 vs. SPSS Modeler Comparison Continues – Setting to Flags

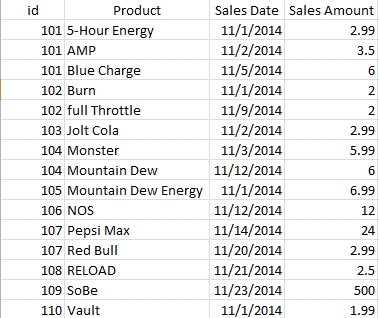
Consider the scenario where you have to convert information held in a “categorical field” into a “collection of flag fields” – found in a transactional source. For example, suppose you have a file of transactions that includes (among other fields) a customer identifier (“who”) and a product identifier (“what”).  This file of transactional data indicates purchases of various energy drinks by unique customer IDs:

b10.1


Aggregation and Flag Fields

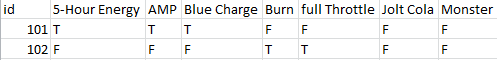
What I need is have a single record per unique customer showing whether or not that customer purchased each of the energy drinks (True or False – not sales amounts) during a period of time. More like:

b10.2


Doing it in TM1

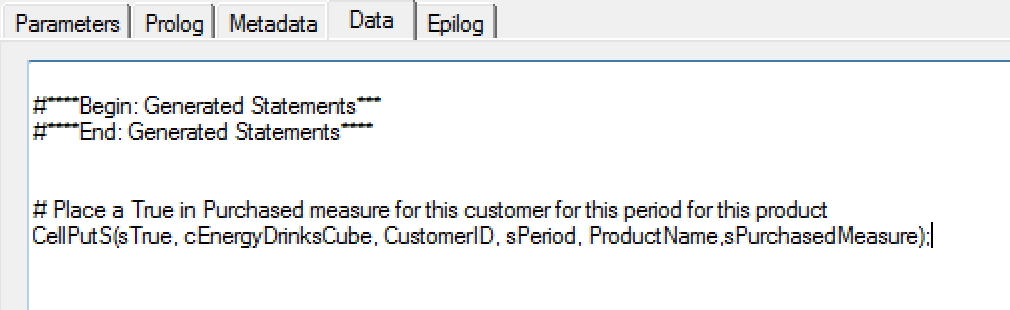
In Cognos TM1, you’d utilize TurboIntegrator to read the file – record by record – aggregating the data (by customer id) and updating each measure (energy drink) – a reasonable trivial process, but still requiring lines  of script to be written. Something (assuming you perhaps initialized the period being loaded to all False values) like:

b10.3


MODELER’s Approach

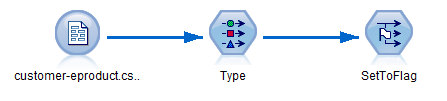
In SPSS MODELER, the SetToFlag node (found in the Field Ops palette) enables you to create the flags you need and to aggregate the data (based on a grouping, or aggregate key fields) at the same time – without writing any script.

In order to have the SetToFlag node populated with the values of the categorical field, the field has to be instantiated so that MODELER knows the values for which to create flag fields. (In practice, this means that your data has to be read in a Type node prior to the SetToFlag node.) The procedure to create flag fields from the file is:

  1. Add a SetToFlag node to your stream.
  2. Edit the SetToFlag node to set the options for the SetToFlag operation.
Data Intelligence - The Future of Big Data
The Future of Big Data

With some guidance, you can craft a data platform that is right for your organization’s needs and gets the most return from your data capital.

Get the Guide

b10.4


Editing the SetToFlag

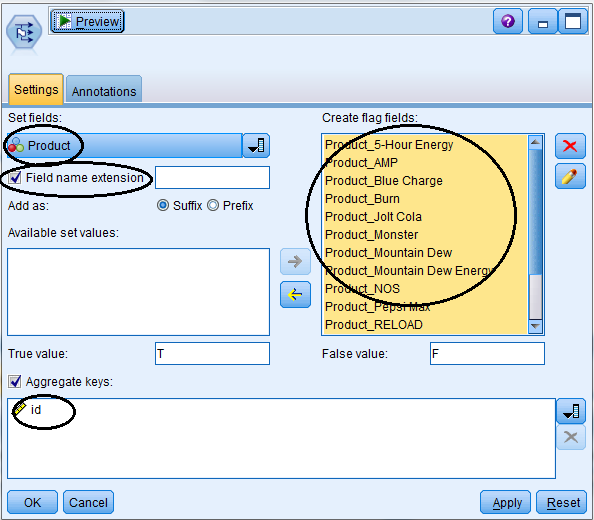
Once you have added your SetToFlag node, you use the Settings tab to:

  1. Select the categorical field to be expanded in flags (I selected “Product”). The Available set value box is populated with its categories (when the data are instantiated).
  2. Optionally, add a field name extension for the new flag field’s names, either as suffix or prefix (I left this blank).
  3. Select the categories for which one wishes to create flag fields in the Create flag fields list box and move them to Create flag fields (I selected all of the products).
  4. True and False value can be changed, if desired (I left it blank – no changed).
  5. Optionally, aggregate records by checking the Aggregate keys check box and selecting the appropriate key field(s) – I selected “id”.

b10.5


Conclusion

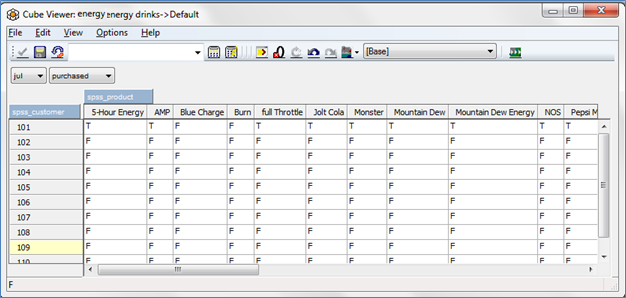
If you go back to the TM1 example, you now have a cube loaded that you can view by customer and period to which products each customer purchased within the period:

b10.8


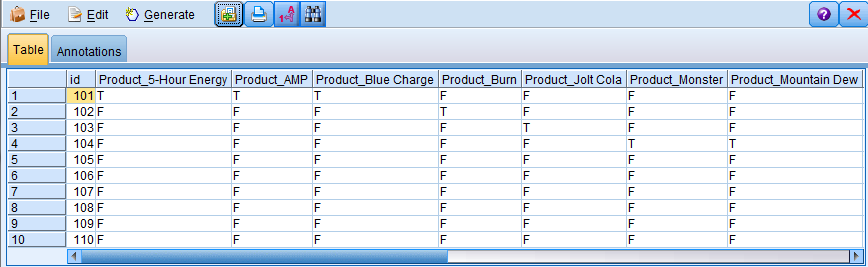
In SPSS Modeler, the output from the SetToFlag node is similar:

b10.7


Next up – Data Sampling Patterns!

Thoughts on “TM1 vs. SPSS Modeler Comparison Continues – Setting to Flags”

Leave a Reply

Your email address will not be published. Required fields are marked *

This site uses Akismet to reduce spam. Learn how your comment data is processed.

Jim Miller

Mr. Miller is an IBM certified and accomplished Senior Project Leader and Application/System Architect-Developer with over 30 years of extensive applications and system design and development experience. His current role is National FPM Practice Leader. His experience includes BI, Web architecture & design, systems analysis, GUI design and testing, Database modeling and systems analysis, design, and development of Client/Server, Web and Mainframe applications and systems utilizing: Applix TM1 (including TM1 rules, TI, TM1Web and Planning Manager), dynaSight - ArcPlan, ASP, DHTML, XML, IIS, MS Visual Basic and VBA, Visual Studio, PERL, Websuite, MS SQL Server, ORACLE, SYBASE SQL Server, etc. His Responsibilities have included all aspects of Windows and SQL solution development and design including: analysis; GUI (and Web site) design; data modeling; table, screen/form and script development; SQL (and remote stored procedures and triggers) development and testing; test preparation and management and training of programming staff. Other experience includes development of ETL infrastructure such as data transfer automation between mainframe (DB2, Lawson, Great Plains, etc.) systems and client/server SQL server and Web based applications and integration of enterprise applications and data sources. In addition, Mr. Miller has acted as Internet Applications Development Manager responsible for the design, development, QA and delivery of multiple Web Sites including online trading applications, warehouse process control and scheduling systems and administrative and control applications. Mr. Miller also was responsible for the design, development and administration of a Web based financial reporting system for a 450 million dollar organization, reporting directly to the CFO and his executive team. Mr. Miller has also been responsible for managing and directing multiple resources in various management roles including project and team leader, lead developer and applications development director. Specialties Include: Cognos/TM1 Design and Development, Cognos Planning, IBM SPSS and Modeler, OLAP, Visual Basic, SQL Server, Forecasting and Planning; International Application Development, Business Intelligence, Project Development. IBM Certified Developer - Cognos TM1 (perfect score 100% on exam) IBM Certified Business Analyst - Cognos TM1

More from this Author

Follow Us
TwitterLinkedinFacebookYoutubeInstagram