
Typically, a TM1 project will include work to create reports. Most finance groups will have a number of Excel workbooks that they are using for both their forecasting and planning as well as for reporting. These workbooks will become the “templates” for designing your TM1 input sheets and reports. For the reports, you will be asked to estimate the effort to “convert” the existing Excel worksheets to (some form of) report “linked” to the TM1 models you build. How do you do that? The following is a strategy for coming up with an estimate you can live with (deliver both on time and on budget) but also actually makes sense to your customer, if they chose to challenge your numbers.
Here we go:
First, the idea is to come up with a realistic estimate without investing significant amounts of time to do a detailed “deep dive” into each report, so it is very important to make it clear that your estimate may change (up or down) based upon the results of relevant events – such as:
- The deep-dive functional reporting requirements
- System testing and remediation
- Application performance testing
- SME feedback
- Etc.
In case they ask, here are some general points:
Deep-dive functional reporting requirements
It may be discovered during the deep-dive that a report contains material that adds complexity to that report. This material may include:
- Business logic applied to the data in the form of Excel or VBA macros, or conditional formatting
- Data points that currently do not exist in the TM1 model or, exist at a different level of detail than what is required
- Security concerns such as the requiring certain areas of the report or types of data displayed in the report to be restricted based upon a client ID
- A requirement to Write-back to the TM1 model
- Potentially excessive rows or columns
System testing and remediation
The results of the system testing and remediation of the TM1 model may result in modifications to the model that may be material to a report. Complexity may be introduced (or removed) from a report based upon the changes to the model:
- Business logic that the report requires may be implemented, modified or removed from the TM1 model
- Data that the report requires may be implemented, modified (detail level data may now be aggregated or summarized) or removed from the TM1 model
- Security changes may affect the report
- Write-back ability may no longer exist (an input cube may be removed from the model) or change significantly
- Data volumes and schedules may change effecting the performance and freshness of the report
Application performance testing
During performance testing of the TM1 model multiple factors can affect the reports design and complexity. The most typical are:
- Moving business logic – converting a TM1 Rule to a TurboInterator process, or moving the logic to another cube, etc.
- Changing data volumes and schedules
- Changing data detail levels
- Removing data (no longer storing it in the TM1 model)
SME feedback
The most important factor will be obtaining the approval of the appropriate subject matter expert. The SME must align to the reports usability and performance. To obtain SME approval and alignment it may be necessary to modify the existing TM1 model (add reporting cubes or compiled reporting views, add TurboIntegrator processes, apply additional security, etc.). It may also be required to deliver the report in multiple ways (Excel sheet, Websheet, Reporting cube View, etc.).
Reporting Design
Developing enterprise reports based upon a Cognos TM1 model can be complex matter. Various options exist for consuming TM1 data and the process of selecting the “right-fit” is dependent on a number of factors (check out some of my earlier posts). Your estimate can NOT be valid until you have alignment on what method you will use for report delivery so your estimate should include a clearly stated (high level) design statement (something like this, perhaps):

Based upon the business requirements, all reports included in this estimatewill be developed as Excel Worksheets and then published as TM1 Websheets (available to all users through TM1 Web and a Web browser). Certain reports that are required to maintain Excel formatting (to later be copied or inserted into presentation decks) will also be saved in raw Excel worksheet form as (TM1) applications and be available to TM1 Perspectives users.
Estimating Strategy
Based upon industry best practice and in-field experience, estimates of effort for delivering TM1 reports is calculated based upon:
- The total number of reports to be developed
- The total number of man-days to complete all of the reports – where “complete” includes gathering detailed requirements, design time, development time, test time (system, performance and acceptance) and deployment.
Total Number of Reports Calculation
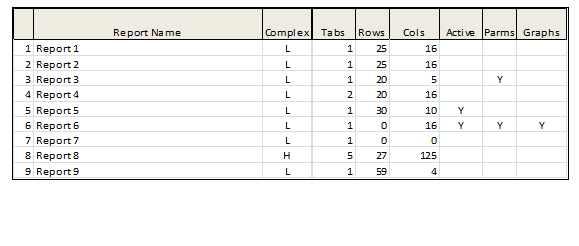
The total number of reports to estimate is based upon a list of reports provided by the business. These reports are standard “book of business” reports and do not include “ad-hoc” or “data mining” queries. It is important to understand that a “report” is defined as a single Excel worksheet, NOT an Excel workbook (which may contain multiple worksheets):
![]()
(single tab)
Man Days Calculation
So here is the interesting one. To determine the number of man days required to complete a report, the following should be considered:
- What are the number of (estimated) rows and columns in the report?
- Will this report need to be an active [1]report?
- Will the report require user-configurable parameters?
- Does the report include graphs or charts?
- Is the report more than “a medium” in complexity level?
Rows and Columns
It is important to have an estimation of the total or average rows and columns that are to be visible and invisible in a report. Reports that have more than 2 or 3 dozen columns or more than 100 rows (basically view of the data that does not “roughly fit” on a single screen (and requires scrolling) will take more effort to deliver. Most often these factors tend to have usability and performance issues and will have to be designed accordingly.
Active Reports
If a report has a fixed number of rows and columns, it is considered to be “format-static” which means that it will always have the same number of rows and columns no matter what data is being displayed. If the number of rows or columns is not fixed (for example a product list that may display a varying number of products based upon filter selections) then it will need to be developed as a TM1 Active form. Active forms take longer to develop.
User Parameters
All reports will display data based upon parameters – the current month, the current year, an entity or region o product, etc. Parameters can be set programmatically by the TM1 model. For example, the model can “know” the current month and year. The report can use this information to filter its data. In some cases, the value of a parameter needs to be user selected. An example would be a report that displays sales for the current month for a user selected product or region. If a report requires the ability for a user to select and set a parameter additional time will be required to develop the report.
Graphs & Charts
Graphing and Charting in a report is accomplished using this Excel functionality. Not all Excel functionality is supported in TM1 Web. Some functionality is supported but not to the same level as native Excel. If a report requires graphs and charts, it may not work well within a Web Browser and will therefore require additional programming to achieve the desired results in both Perspectives and TM1 Web. In addition, there is always extra work require when implementing a graph or chart in a report: step 1 – collect the data, step 2 – graph or chart the data.
Complexity
The reports complexity level should be established as part of the estimate assessment. This is a subjective exercise. Typically, standard finance reports like a P&L or Balance sheet are low level complexity reports, while “one of a kind” or reports specific to a particular business and require knowledge of a business practice would most likely be medium or even high in complexity level. There are also other factors to consider: account naming differences, precision, write-backs, graphing and charting, “presentation books” (usually a deck of reports or a workbook with multiple tabs that all must be delivered in a “set” or “collection”), special or conditional formatting, security, etc
Assessment Matrix
Once you have performed the above assessment, you should prepare a matrix (and publish it as part of your estimate):
Finally, the estimate
Now that you have a handle on the reports (individually and in total) you can use that information to assign man days to each report. A couple of hints:
- Nothing gets done in 1 day
- Split the total days for each report into “time for requirements and design” and “time to build and test”
- Keep the big picture in mind – although building each report may break down into a separate work task, be sure to look for consistencies across the reports – most reports will share data points or functionalities that you may able to leverage (build once and use in several reports)
- A lot of the deep-dive detail requirements work will be valid in most of the reports, meaning time spent mapping data names from Excel to TM1 for 1 report will apply to a lot of the other reports (you won’t have to redo it)
- Look for ways to use a single report format as multiple reports – usually accomplished by adding user configurable parameters to a report. This may increase the effort of building a report, but may eliminate the need for multiple other reports.
- Estimate based upon your resources ability. Estimating as if all of your resources are expert level is a recipe for failure.
Of course a lot of estimating is based upon plain old experience (good and bad) – but I hope this strategy got you thinking and perhaps you can use it on your next project. If you’d like help, I would be happy to help with aan estimation consultation. Give me a call!
Jim, Very good write-up on reporting for TM1. If a client has Cognos Business Intelligence in addition to TM1, would you advocate using BI versus the TM1 reporting tools? I’ve developed/modified some in-depth reports using Active Forms and MDX and believe that the BI reporting tools would simplify the development effort.