
AI this, AI that. It seems like everyone is trying to shoehorn AI into everything even if it doesn’t make sense. Many of the use cases I come across online are either not a fit for AI or could be easily done without it. However, below I explore a use case that is not only a good fit, but also very much accelerated by the use of AI.
The Use Case
In the retail world, sometimes you have products that don’t seem to sell well even though they might be very similar to another product that does. Being able to group these products and analyze them as a cohort is the first useful step in understanding why.
The Data and Toolset
For this particular exercise I will be using a retail sales dataset from Zara that I got from Kaggle. It contains information about sales as well as the description of the items.
The tools I will be using are:
-
- Ollama (to run LLMs locally)
-
- Gemma3 LLM
-
- Python
-
- Pandas
-
- Langchain
-
- Python
High-level actions
I spend a lot of my time design solutions and one thing I’ve learned is that creating a high-level workflow is crucial in the early stages of solutioning. It allows for quick critique, communication, and change, if needed. This particular solution is not very complex, nevertheless, below are the high-level actions we will be performing.
- Load the csv data onto memory using Pandas
- Create a Vector Store to store our embeddings.
- Embed the description of the products
- Modify the Pandas dataframe to accommodate the results we want to get.
- Create a template that will be sent to the LLM for analysis
- Process each product on its own
- Get a list of comparable products based on the description. (This is where we leverage the LLM)
- Capture comparable products
- Rank the comparable products based on sales volume
- Output the data onto a new CSV
- Load the CSV onto PowerBI for visualization
- Add thresholding and filters.
The Code
All of the code for this exercise can be found here
The Template
Creating a template to send to the LLM is crucial. You can play around with it to see what works best and modify it to fit your scenario. What I used was this:
template = """<br> You are an expert business analyst that specializes in retail sales analysis.<br> The data you need is provided below. It is in dictionary format including:<br> "Product Position": Where the product is positioned within the store,<br> "Sales Volume": How many units of a given product were sold,<br> "Product Category": The category for the product,<br> "Promotion": Whether or not the product was sold during a promotion.<br> There is additional information such as the name of the product, price, description, and more.<br> Here is all the data you need to answer questions: {data}<br> Here is the question to answer: {question}<br> When referencing products, add a list of the Product IDs at the end of your response in the following format: 'product_ids = [<id1>, <id2>, ... ]'.<br>"""When we iterate, we will use the following as the question:
question = f"Look for 5 products that loosely match this description: {product['description']}?"The output
Once python does its thing and iterates over all the products we get something like this:
| Product ID | Product Name | Product Description | Sales Volume | Comparable Product 1 | Comparable Product 2 | … | Group Ranking |
| 185102 | BASIC PUFFER JACKET | Puffer jacket made of tear-resistant… | 2823 | 133100 | 128179 | … | 1 |
| 187234 | STRETCH POCKET OVERSHIRT | Overshirt made of stretchy fabric…. | 2575 | 134104 | 182306 | … | 0.75 |
| … | … | … | … | … | … | … | … |
Power BI
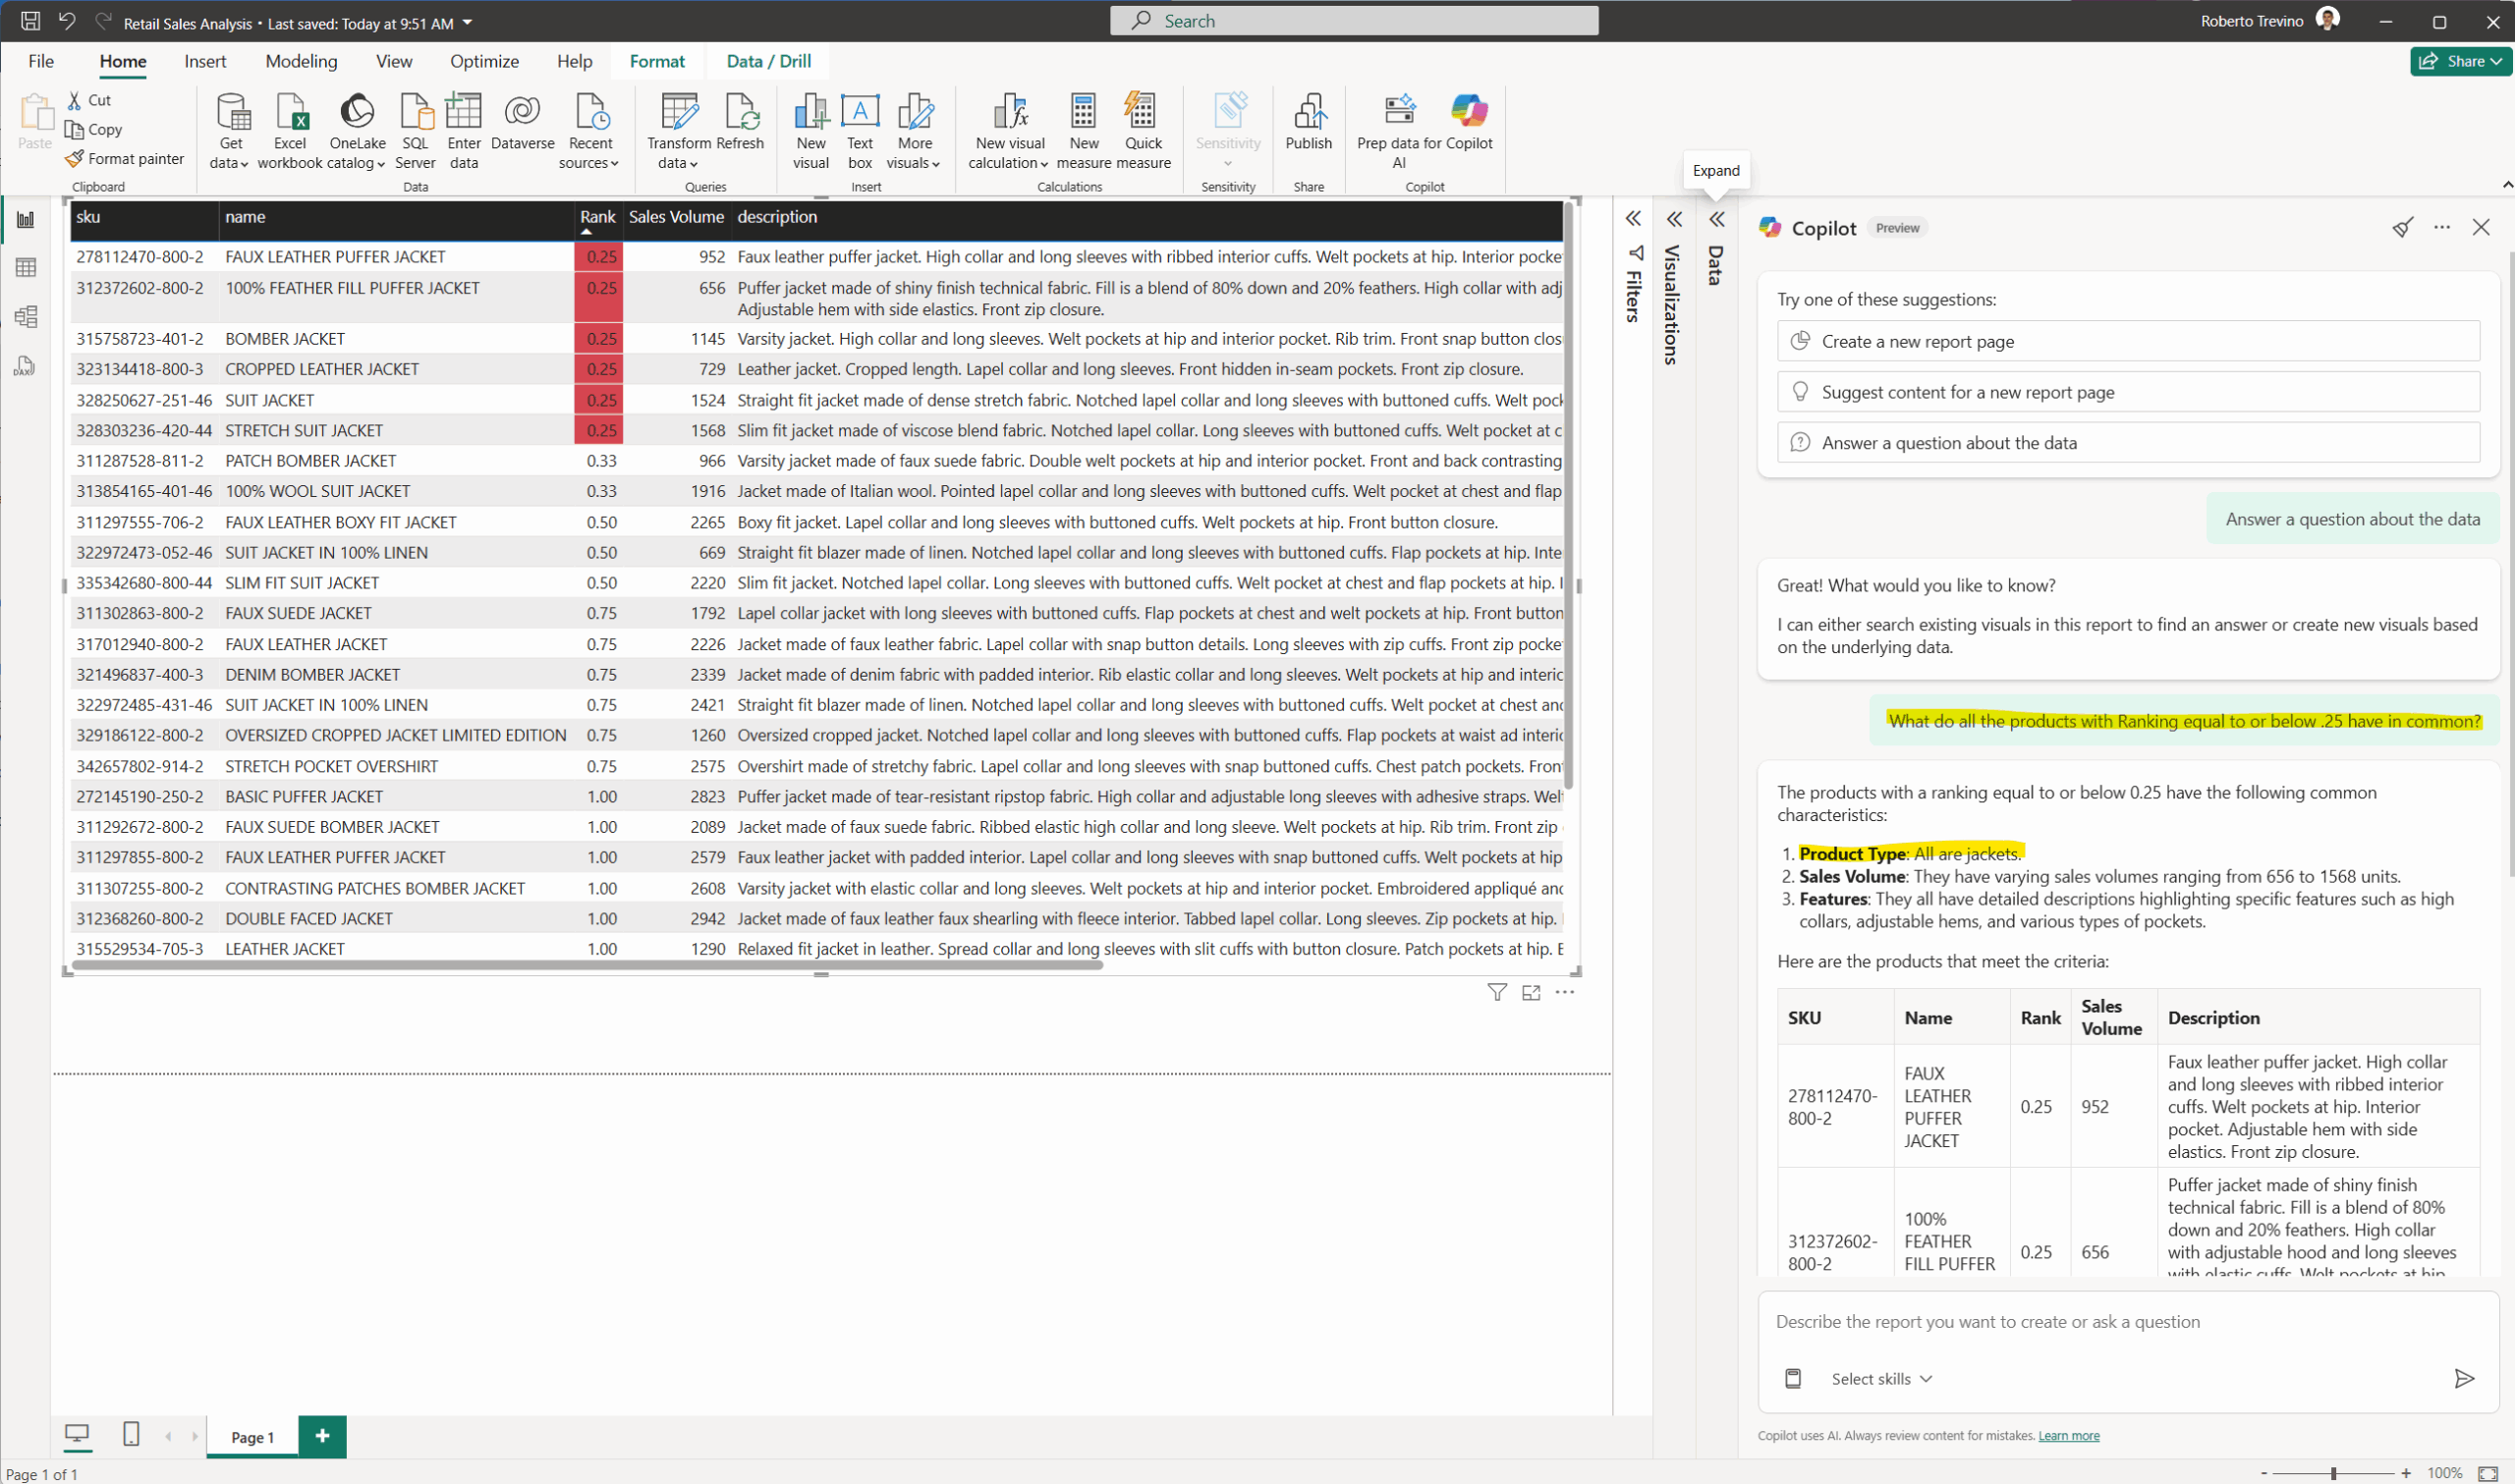
We then load the data onto Power BI to visualize it better. This will allow us to not only analyze the data using filtering and conditional formatting, but we can also explore the data even further with Copilot.
Look at the screenshot below. I’ve initially setup conditional formatting so that all the products that rank low within their group are highlighted.
I then used Copilot to ask how all of these relate to each other. It was quick to point out that all of them were jackets.
This arms us with enough information to go down a narrower search to figure out why the products are not performing. Some other questions we could ask are:
- Is this data seasonal and only includes summer sales?
- How long have these jackets been on sale?
- Are they all sold within a specific region or along all the stores?
- etc.
Conclusion
Yes, there are many, many use cases that don’t make sense for AI, however there are many that do! I hope that what you just read sparks some creativity in how you can use AI to further analyze data. The one thing to remember is that in order for AI to work as it should, it needs contextual information about the data. That can be accomplished via semantic layers. To know more, got to my post on semantic layers.
Do you have a business problem and need to talk to an expert about how to go about it? Are you unsure how AI can help? Reach out and we can talk about it!