DAX provides a whole host of powerful time intelligence functions, allowing you to do things like build custom calendars, define dynamic date ranges, and compare performance over specific periods.
Common Use Cases:
- Creating custom calendar tables with DAX instead of using the default auto-generated versions.
- Writing measures to calculate period-over-period, moving average, or running total calculations.
- Managing non-traditional time periods such as week-based retail calendars instead of the traditional January 1 to December 31 calendar.
Automatic Hidden Date Tables
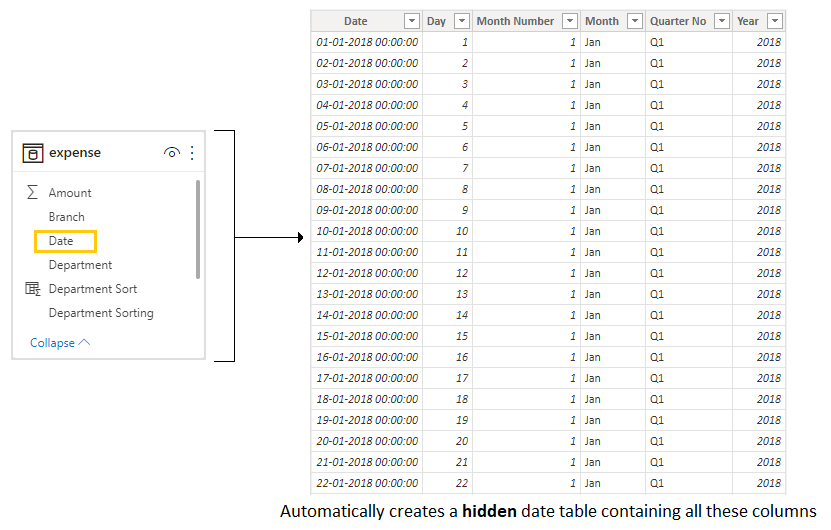
One of the features of Power BI is that by default it automatically creates a hidden date table for each date or datetime column that is on one side of a relationship in the Data Model.
If you import one or more than one tables, like the expenses table, a date table will automatically be generated for each of them.
For example, let’s say you import an expense table that has a date column, this could be a bill date, an order date, a sale date, or a ship date. Power BI will create hidden calendar date table for each of these fields.
What exactly is included in these hidden date tables?
All of these autogenerated date tables will include a consistent date range by the end of the year that is shown in the table you imported, regardless of the actual date range within that table.
If you import the table which has only dates from 1st April 2022 to 31st October 2022. The automatic date table will include every date for 2022.
Example:
We have an expense table and our date, and that is the single date column for this table. Now, what does Power BI do, behind the scenes? It creates a table which has all these columns. So, date, day number, month number, month name, quarter number, quarter name, and year and remember this happens for each date column. This is one side of the relationship in the model.
So, you might be wondering at this point why are they there? Why would Power BI do something like this? Could this potentially affect performance and model size? What is their purpose?
So, let’s clear it by knowing its advantages and disadvantages.

Advantages And Disadvantages (Automatic Hidden Date Tables)
Advantages:
- Calendar tables are automatically generated, which means you can import a dataset into Power BI and create a visual within seconds without the need to import a calendar table or create one from scratch.
- Time intelligence functions such as PREVIOUSQUARTER, SAMEPERIODLASTYEAR which can be used by default, making it easy to quickly create a visual that looks something like the previous quarter or last year.
- This feature helps make your workflow a little easier, so you won’t need to add the calendar table or do data modeling work after the calendar table is imported and to maintain the entire management side.
- You don’t need to have an advanced understanding of DAX to use the Time Intelligence functions and understand their capabilities.
Disadvantages:
- This will increase the size of the model, as it technically remains in the model, even if it is hidden. For example, if you import the table which has only dates from 1st April 2022 to 31st October 2022. The automatic date table will include every date from Jan to Dec for 2022.
- These tables are generated for each date field in each dimension table or for each separate table that is not connected through a relationship.
- Each date table can only filter the table it belongs to. The date filter from these auto date tables does not propagate or cross reference table relationships.
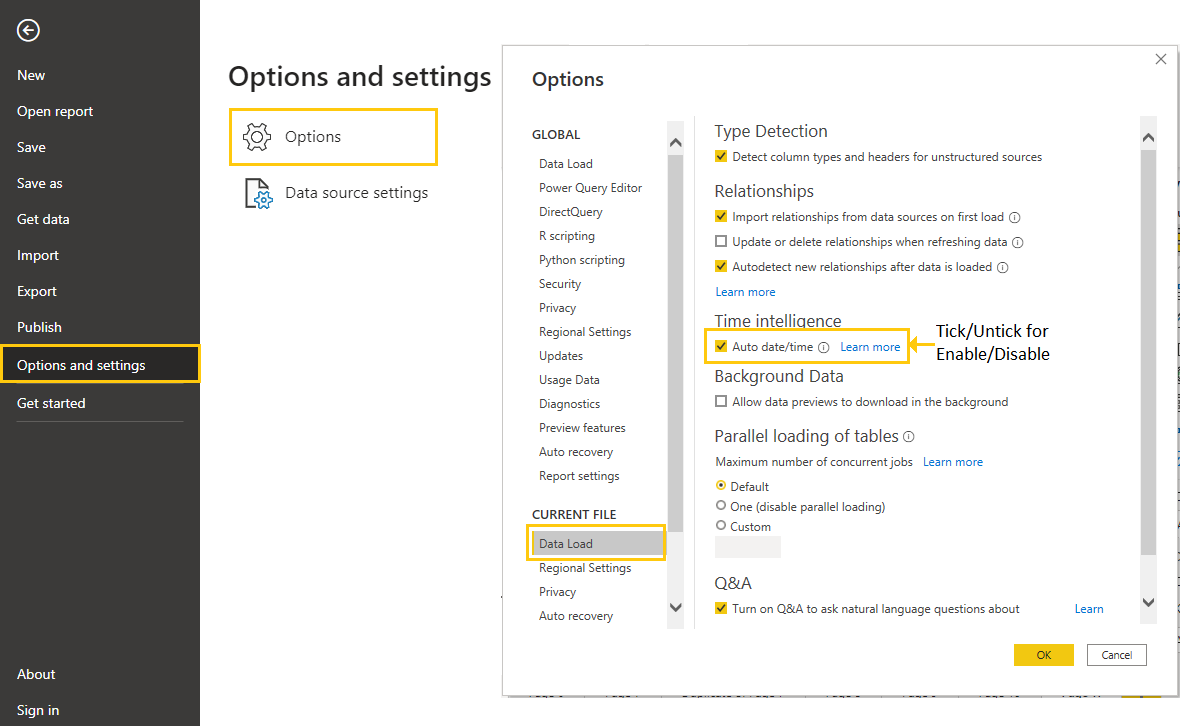
- Date tables can’t be enabled or disabled at the individual table level. They’re either ON or OFF. Therefore, if you turn off this feature through the Settings menu, you are globally disabling this automatic data table. There’s no way to control this on individual field or table basis.

Important Point:
Turn OFF the Auto Date/Time feature in Power BI Desktop. Ultimately you would be better off importing a date dimension table or creating one using functions such as CALENDAR or CALENDARAUTO.
Date Table Requirements
If you import or create your own date table in the query editor or with DAX, it must meet these requirements:
- It must contain all of the days for all of the years that are represented in your fact tables.
- The table must have at least one field that is set as a Date or DateTime datatype.
- Date table should contain all dates but should not contain duplicate dates or datetime values. If duplicate dates are included, the date column will no longer be considered a unique list and by definition will not be a primary key in that case, it will be considered a fact table.
- If you are using a time component with a date column, the time component must be the same for all rows contained in that column.
- The date table and more specifically, the date column should be marked as the date table within your model. This isn’t strictly required but it’s a best practice.
Important Point:
If time is present in your date field, you must split the time component into a different column. This way you’ll be able to keep the time component within your date table while adhering to all of the previous requirements.
CALENDAR
CALENDAR() returns a table with one column of all dates between a defined start and end date
= CALENDAR(StartDate, EndDate)
It has two parameters a start date and an end date and these parameters can be specified either explicitly using a function like DATE and specifying specific start and end dates or you can use a DAX function like MIN and MAX to create a range of dates based on a date column within your data model.
Examples:
CALENDAR(
DATE(2019,01,01),
DATE(2020,12,31)
)CALENDAR(
DATE(YEAR(MIN(Expense[Date])),1,1),
DATE(YEAR(MAX(Expense[Date])),12,31)
)
The output of the calendar using either one of these arguments would be something like the following:

Where you would have a single-column table that contains all of the dates within the date range that you specified. In this example we are looking at 01st January 2018 and it would continue all the way down until 31st December 2020 because that’s the max date of our expense table.
CALENDARAUTO
CALENDARAUTO() returns a table with one column of dates based on the end month of the fiscal year. The date range is automatically calculated based on the data and the data model.
= CALENDARAUTO(FiscalYearEndMonth)
CALENDARAUTO has a very simple syntax with only one argument, which is the last month of the fiscal year and is written as an integer value from 1 to 12.
Examples:
Calendar Table =
VAR MinYear = YEAR(MIN(Expense[Date]))
VAR MaxYear = YEAR(MAX(Expense[Date]))
RETURN
FILTER(
CALENDARAUTO(),
YEAR([Date]) >= MinYear &&
YEAR([Date]) <= MaxYear
)= CALENDARAUTO()
CALENDARAUTO() generates all the dates from 1st Jan to 31st Dec for all years in your data model.

= CALENDARAUTO(6)
Let’s think about the expense table our date set starts on 1st January 2018. If we were to write something like CALENDARAUTO(6) we’d be indicating that 30th June is the end of our fiscal year. So, CALENDARAUTO(6) would return a table that starts on 1st July 2017 and it would look something like this.

Conversely, if we had written CALENDARAUTO(12), our date range would have start on 1st January 2018. Therefore, entering that integer value from 1 to 12 lets you define the starting month of your fiscal year.
Reusable Date Table
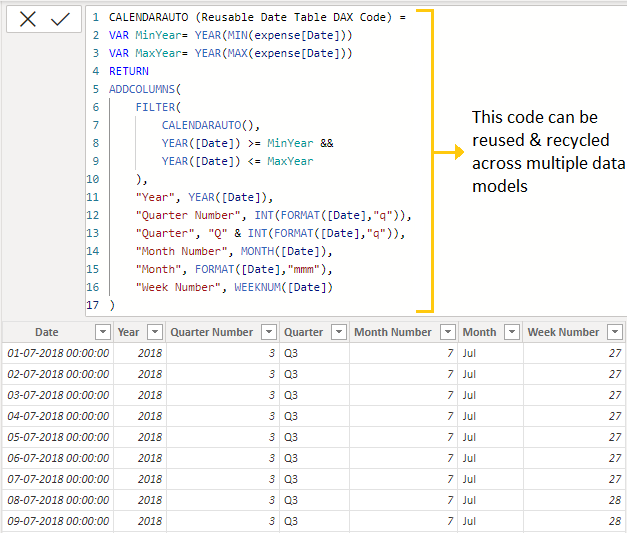
In the following example of a DAX expression, first we define the minimum and maximum years of our expense table and then from there, these inputs are used with CALENDARAUTO to return the overall date range.
In addition to this, we’re also using ADDCOLUMNS to add some extra columns to the output of the table created by FILTER and CALENDARAUTO. So, for things like year, quarter name, quarter number, etc and the output of this is the below calendar table. The great thing about this DAX expression is that you can use it with other Power BI reports to create a calendar table. You only need to change the table and column references that are in the variables above.

Date Formatting
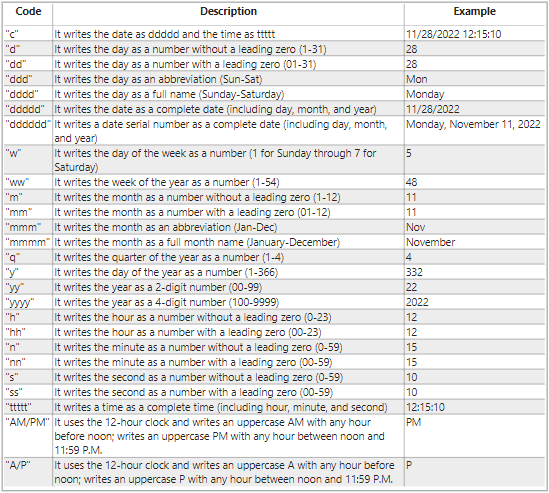
Use the FORMAT function to specify date/time formatting.
= FORMAT(value, format string, [locale name])
Example:
= FORMAT(Calendar[Date],"yyyy-mm-dd")
Common examples include:


Nice I am happy with this site.