
Why Performance Analytics?
It is crucial for an organization to have reliable and efficient services. However, such services are not always easy to use and may not have the visibility, alignment, and reporting that you are looking for.
With the help of ServiceNow’s performance analytics, you can quickly and effectively make decisions with pre-built KPIs and dashboards that are adaptable to all corporate digital workflows.
Consider the difference between using GPS navigation and driving without it. Without GPS, you choose your path based on past experiences without understanding what lies ahead. However, based on current traffic data, GPS gives you the best route possible.
Performance analytics offers precise, real-time insight into all aspects of service performance across the ServiceNow platform, which is one of their benefits. So, you can quickly spot potential improvement areas and roadblocks.
ServiceNow Performance Analytics Benefits:
- Anticipate trends: monitor performance to spot problem areas and prevent service problems
- Prioritize resources: identify what’s important and modify service coverage
- Drive automation and self-service: quickly pinpoint where automation and self-service can boost productivity, cut costs, and
- Informed Decision Making: By coordinating IT services and operations with company strategy, you may advance the business and speed up outcomes.
Key Features:
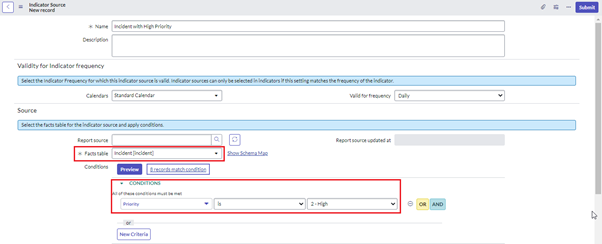
- Indicator Sources
- Groups of records from a ServiceNow table share a common attribute, such as assignment group or priority.
- Create indicator sources with care because an indicator source can be used by multiple indicators.
- Let’s say you only want incident records that have a high priority. Choose the facts table from the indicator source and apply the conditions as needed. As shown below:
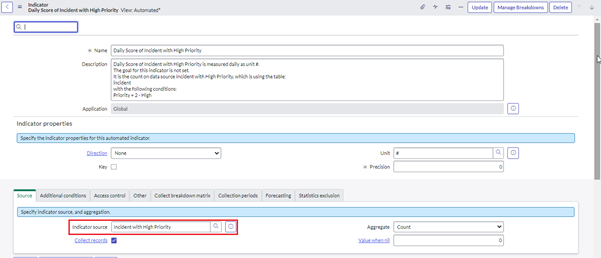
- Indicators:
- Used to monitor performance over time.
- They use indicator sources to compute scores.
- To forecast future trends, compare previous and present performance using indicators.
- There are three types of indicators.
- Automated Indicator: Scores are automatically collected using scheduled data collection jobs.
- Manual Indicator: Scores are entered manually or imported from a third-party source.
- Formula Indicator: Scores are calculated using scores of other indicators.
- Let’s say we want daily scores of incidents with high priority. Select the indicator source you created based on your needs in the field “Indicator source.” As shown below:
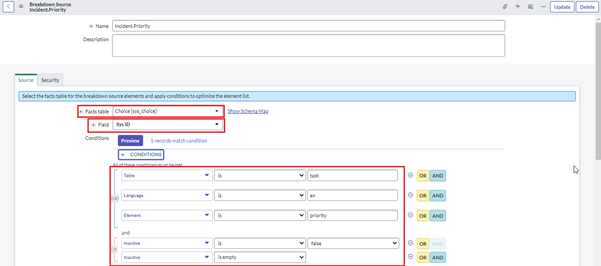
- Breakdown Sources:
- Define which elements are unique to a breakdown.
- Is a collection of records from a table or database view.
- One breakdown source can be used in multiple breakdowns.
- Assume we want to categorize all incidents based on their priority. Choose the facts table from the breakdown source and apply the conditions as needed. As shown below:
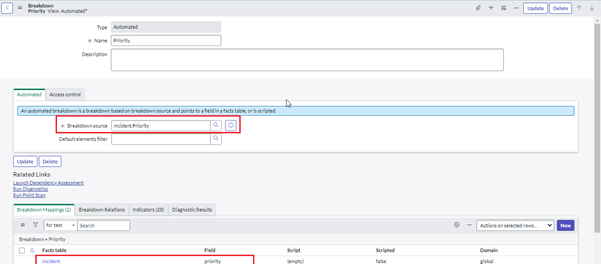
- Breakdown:
- Breakdown is used to gain a deeper understanding of the data and break it up in a meaningful way.
- Breakdowns are configured only on reference or choice fields i.e., priority, state, or assignment group.
- There are two types of breakdowns:
- Automated Breakdown: Automated breakdown elements are constructed from data already present in breakdown sources.
- Manual Breakdown: Elements of manual breakdowns are manually typed to specify an organization.
- With breakdown, you can all open incidents that meet certain
- Choose the breakdown source you created per the requirements in the filed “Breakdown Source.” As shown below:
- Data Collector:
- The process collects data scores from indicators and displays them on the dashboard using widgets.
- In performance analytics, two types of data collectors are available:
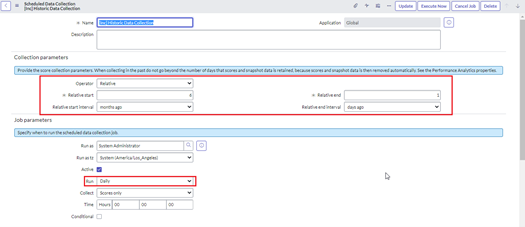
- Historical Data and Daily Data Collector:
-
-
- Used to collect historical data. This can be illustrated with real-world examples.
- Can identify how many incidents or problems were resolved within a certain timeframe using the ‘Relative Start’ and “Relative End’ fields.
- You can specify how often a data collector runs using the “Run” parameter. As shown below:
-
-
-
- A daily data collector is used to collect data every day. For example, assume we need to keep track of the number of incidents resolved each day. Then we should make use of the daily data collector.
-
- Widgets:
- Widgets are used for the visualization of indicator scores and can be reused across multiple dashboards. There are several performance analytics widgets.
- Time Series: display how an indicator score has changed over time.
- Breakdown: Indicator scores for each breakdown element.
- Score: Indicator aggregate scores
- List: Multiple indicators’ scores.
- Widgets are used for the visualization of indicator scores and can be reused across multiple dashboards. There are several performance analytics widgets.
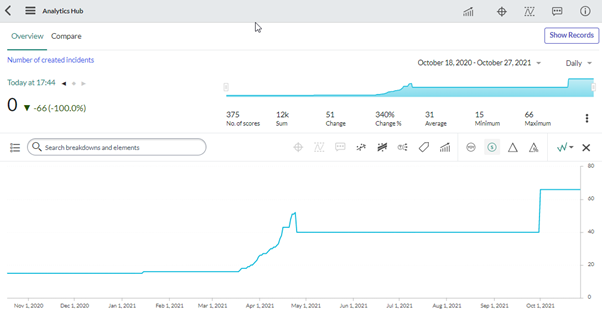
- Analytics Hub:
- User interface that is mainly for assessing, comparing, and predicting the performance of indicators over time.
- Displays data for a single indicator.
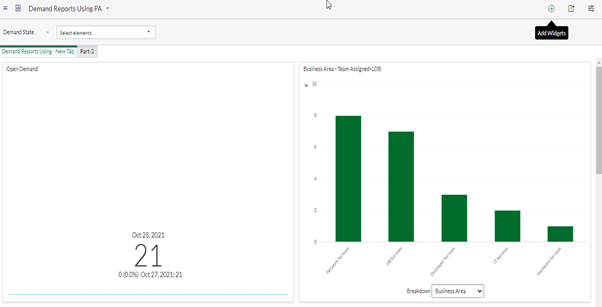
- Dashboards:
- Dashboards are used as a canvas to combine several widgets and reports into a single display to convey visual information about one or more business processes or services.
- Users with admin and dashboard_admin roles assigned can access and edit all dashboards.
- Users with pa_admin and pa_power_user roles assigned can access only those dashboards that they have created or that have been shared with them with edit rights.
- The content of the dashboard can be arranged with the help of tabs and widgets.

- A dashboard may contain several tabs. On each tab, you can keep one or more widgets.
Interesting Blog
Hi team,
You guys explained very well.
I have one query that is you guys are not explained about breakdown mapping.
Please let me know about breakdown mapping briefly.
Best Regards,
Sri Harsha
Hi Harsha,
I was planning to publish another blog on performance analytics which will cover this topic thoroughly.
Regards.
Thanks Arpit.
Fabulous Job Prajwal well appraised, expecting more content about the PA topics and scenarios (example)
Thank you. Sure I will.