
What are Calculation Groups and Why these are so important?
Imagine you have the Data Model, and you created couple of measures let’s say 2 measures and then suddenly the requirement changes, now you need to create Month to Date (MTD), Year to Date (YTD), Previous Year Calculation and Year Over Year Calculation (YOY). What would you do? You must create 4-5 corresponding measures for each field such as (Total Revenue, Profit, %Profit etc) and that is a lot of work with Calculation Groups you can minimize that work. Let’s see how to achieve it.
In the below Model, we need to create group of measures for Sales such as MTD, QTD, YTD, YOY, YOY% and all these measures are only for one field (Sales).Now Imagine you have to create these measures for multiple fields then you will have a lot of measures which can create confusion. How can you minimize the number of measures? The Answer is Calculation Groups.
There are couple of ways to create the Calculation Groups, but we are going to achieve it by using Tabular Editor available in External Tools.
Let’s see the process step by step.
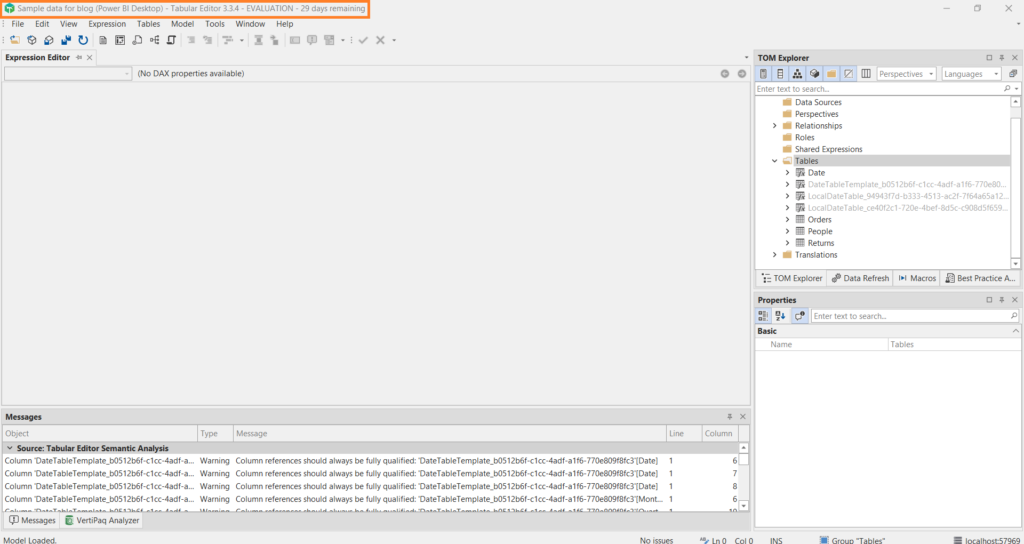
> Select the Tabular Editor and you can see it is already connected to the Model.
> Right click on the table, choose – create new, select Calculation Groups
and you will see a new table is created, just give it a name.
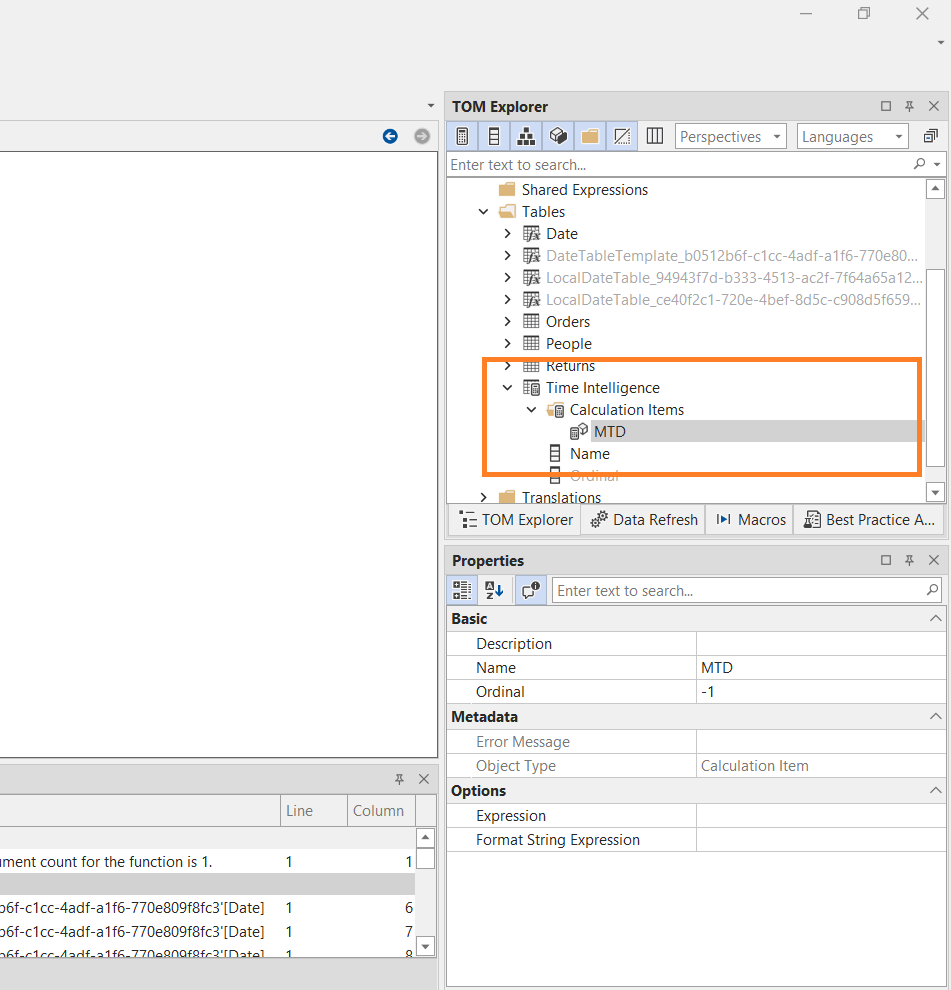
> Calculation Groups is one single column table which consist of multiple rows and the rows is based on Calculation Items that we are going to create.
> Right click on Calculation Items and select new Calculation Items, let’s say Month to Date (MTD).
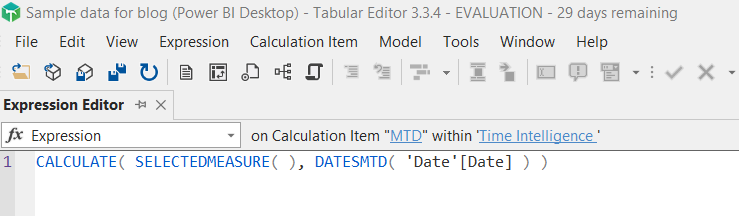
> After this we need to write the DAX for MTD in Tabular Editor (you can simply copy it from the Power BI if you have already created it) then replace the field for which we are calculating the MTD with the Scaler function SELECTEDMEASURE (). What this function will do is, if we drag Sales to the table this measure will give us the MTD Sales and if we drag Quantity to the table we will get the MTD Quantity and so on.

> Repeat this above process for each of the time-based calculations you want such as YTD, QTD, Previous Year, YOY etc.
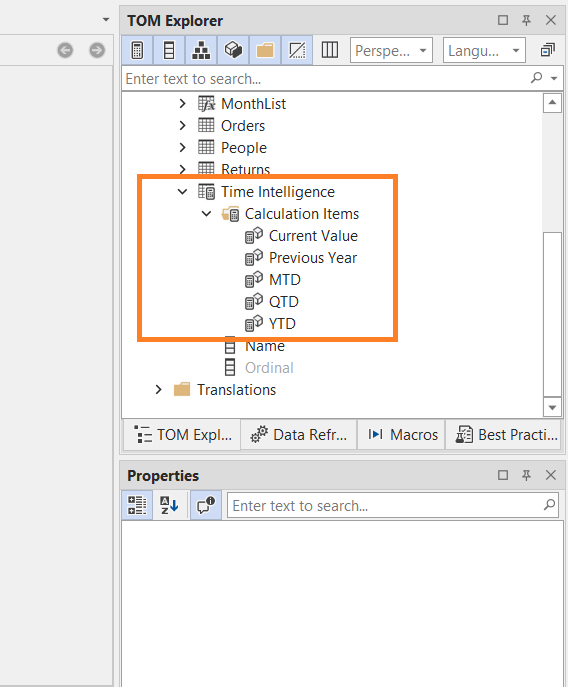
> The thing here is, you need to create these measures once only, after that those will work for you each time against the fields.
> After saving this, you can move back to the Power BI and hit the refresh now, you will see our table and column which we have created.
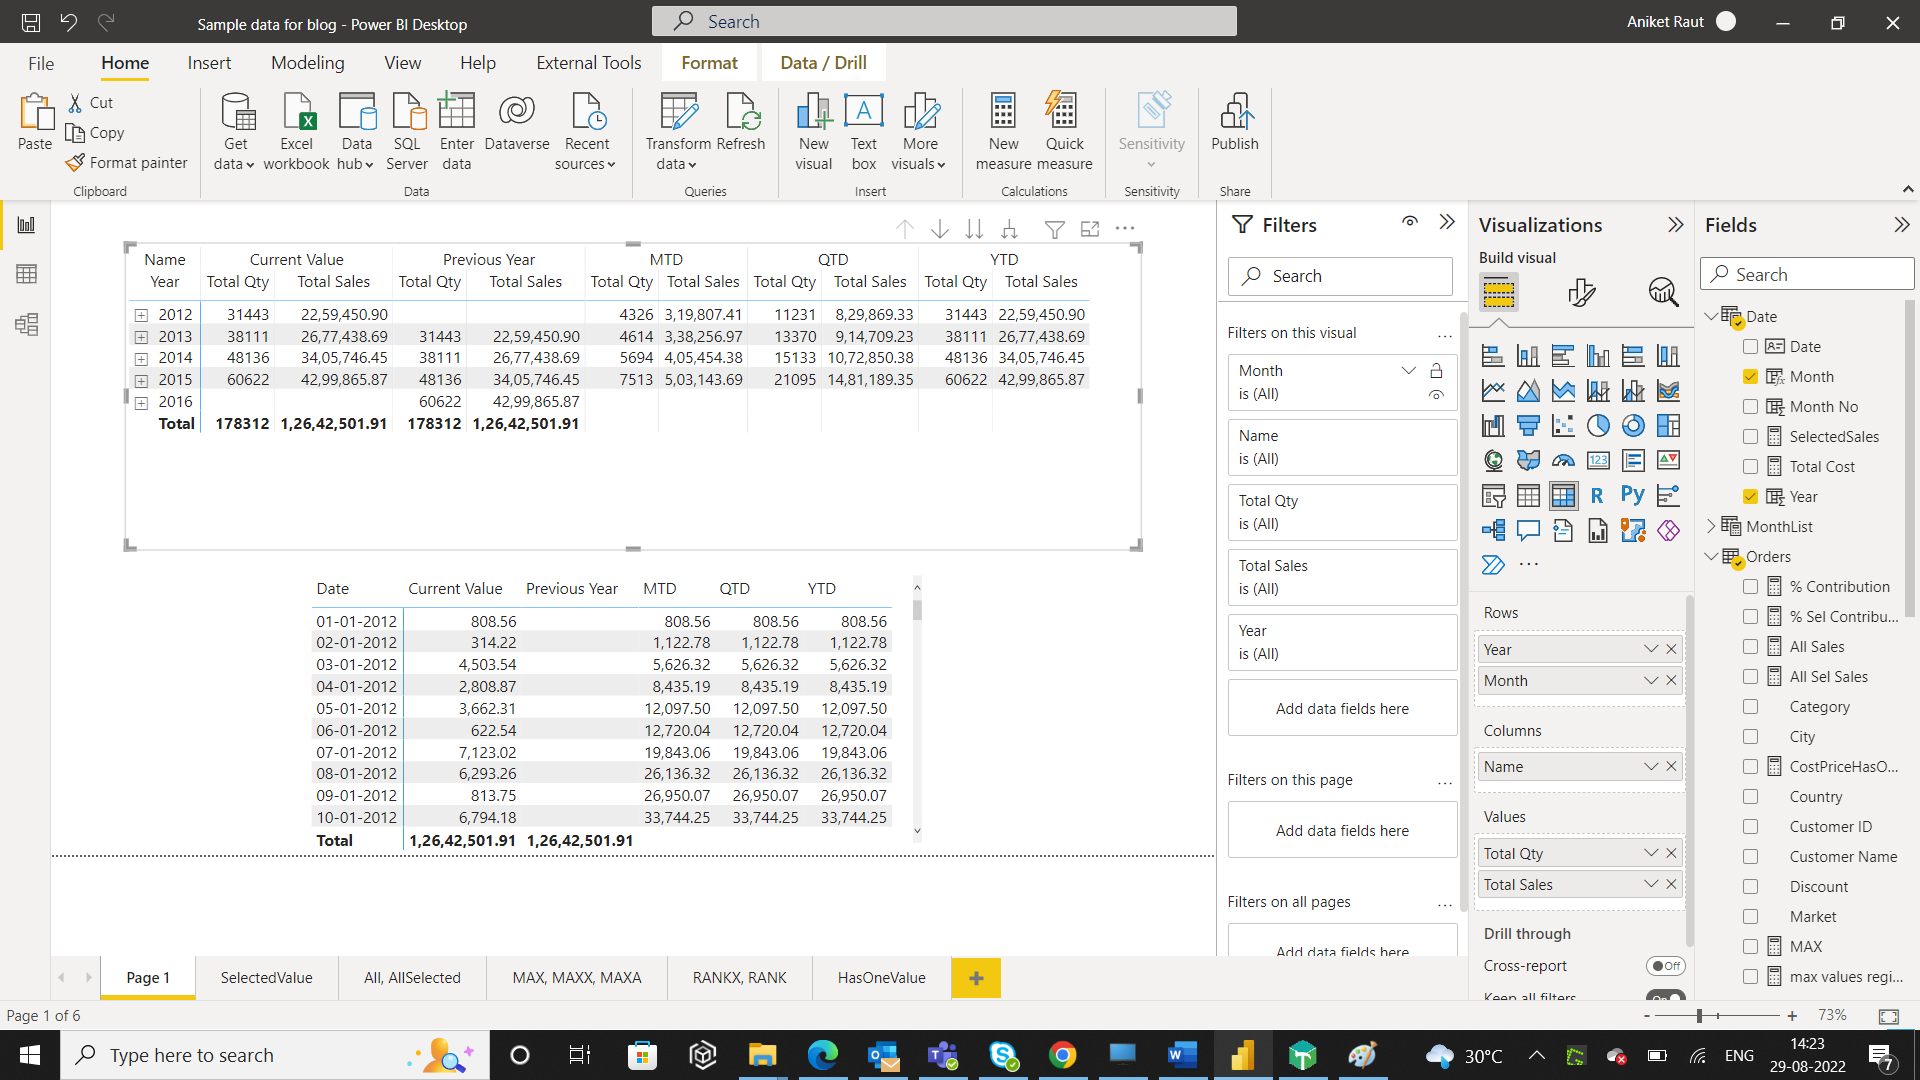
For our demonstration we are using one Matrix and let’s say for example add sales to the values and year or any date hierarchy (as per the requirement) and just drag the “Name” column form the our table and what we will see is, all of those calculations are added in the table, we don’t need to use all those individual measures neither there is any need to create the number of measures for each of the fields.
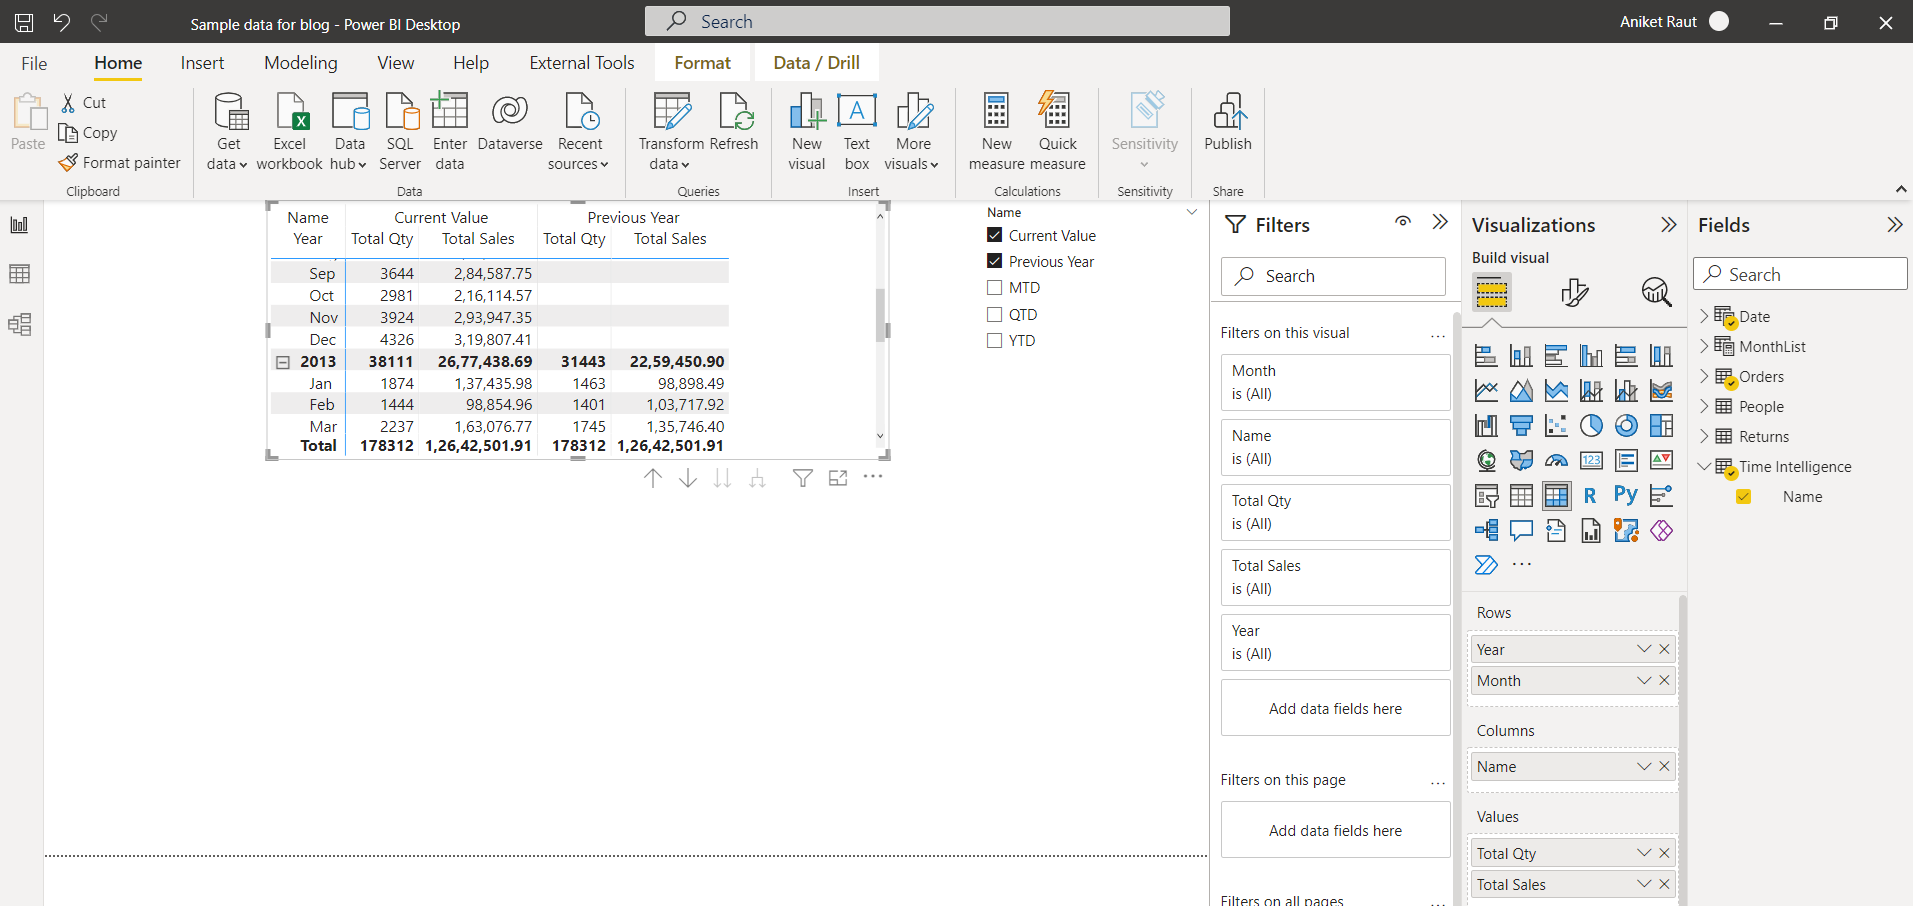
For effectively representing the data we can use the slicer. By adding our created column to it we can show the specific data for example in this case we have selected current value and previous year.
In this way we can best utilize the time by avoiding the number of times the Measures we need to create and hence eliminate the possibility of confusion between them.
Very insightful information !!
Well done presentation. Any chance to get a copy of the pbi file?
Thanks