Not long ago I posted a blog series on Direct Routing, which I highly encourage you to check out if your organization will be going this route. To add on to this, Microsoft has recently released a Health Dashboard for Microsoft Teams Direct Routing which will allow you to monitor your connection between your SBC and the Direct Routing interface. In this article we’ll break down the capabilities of the Health Dashboard and show how useful this new feature can be for monitoring and troubleshooting your Direct Routing environment.
Health Dashboard for Direct Routing
With this latest update to the Microsoft Teams admin portal you can now monitor information about your:
- SBC
- Telephony Service
- Network parameters between the SBC and the Direct Routing interface
With this new holistic view to Direct Routing monitoring you can quickly identify issues such as dropped calls and find the root cause (i.e. expired certificates or network issues). Microsoft has approached this monitoring in 2 different ways:
- Looking at overall health of the connected SBC’s
- Digging deeper into more detailed information about the connected SBC’s
Overall Health of connected SBC’s
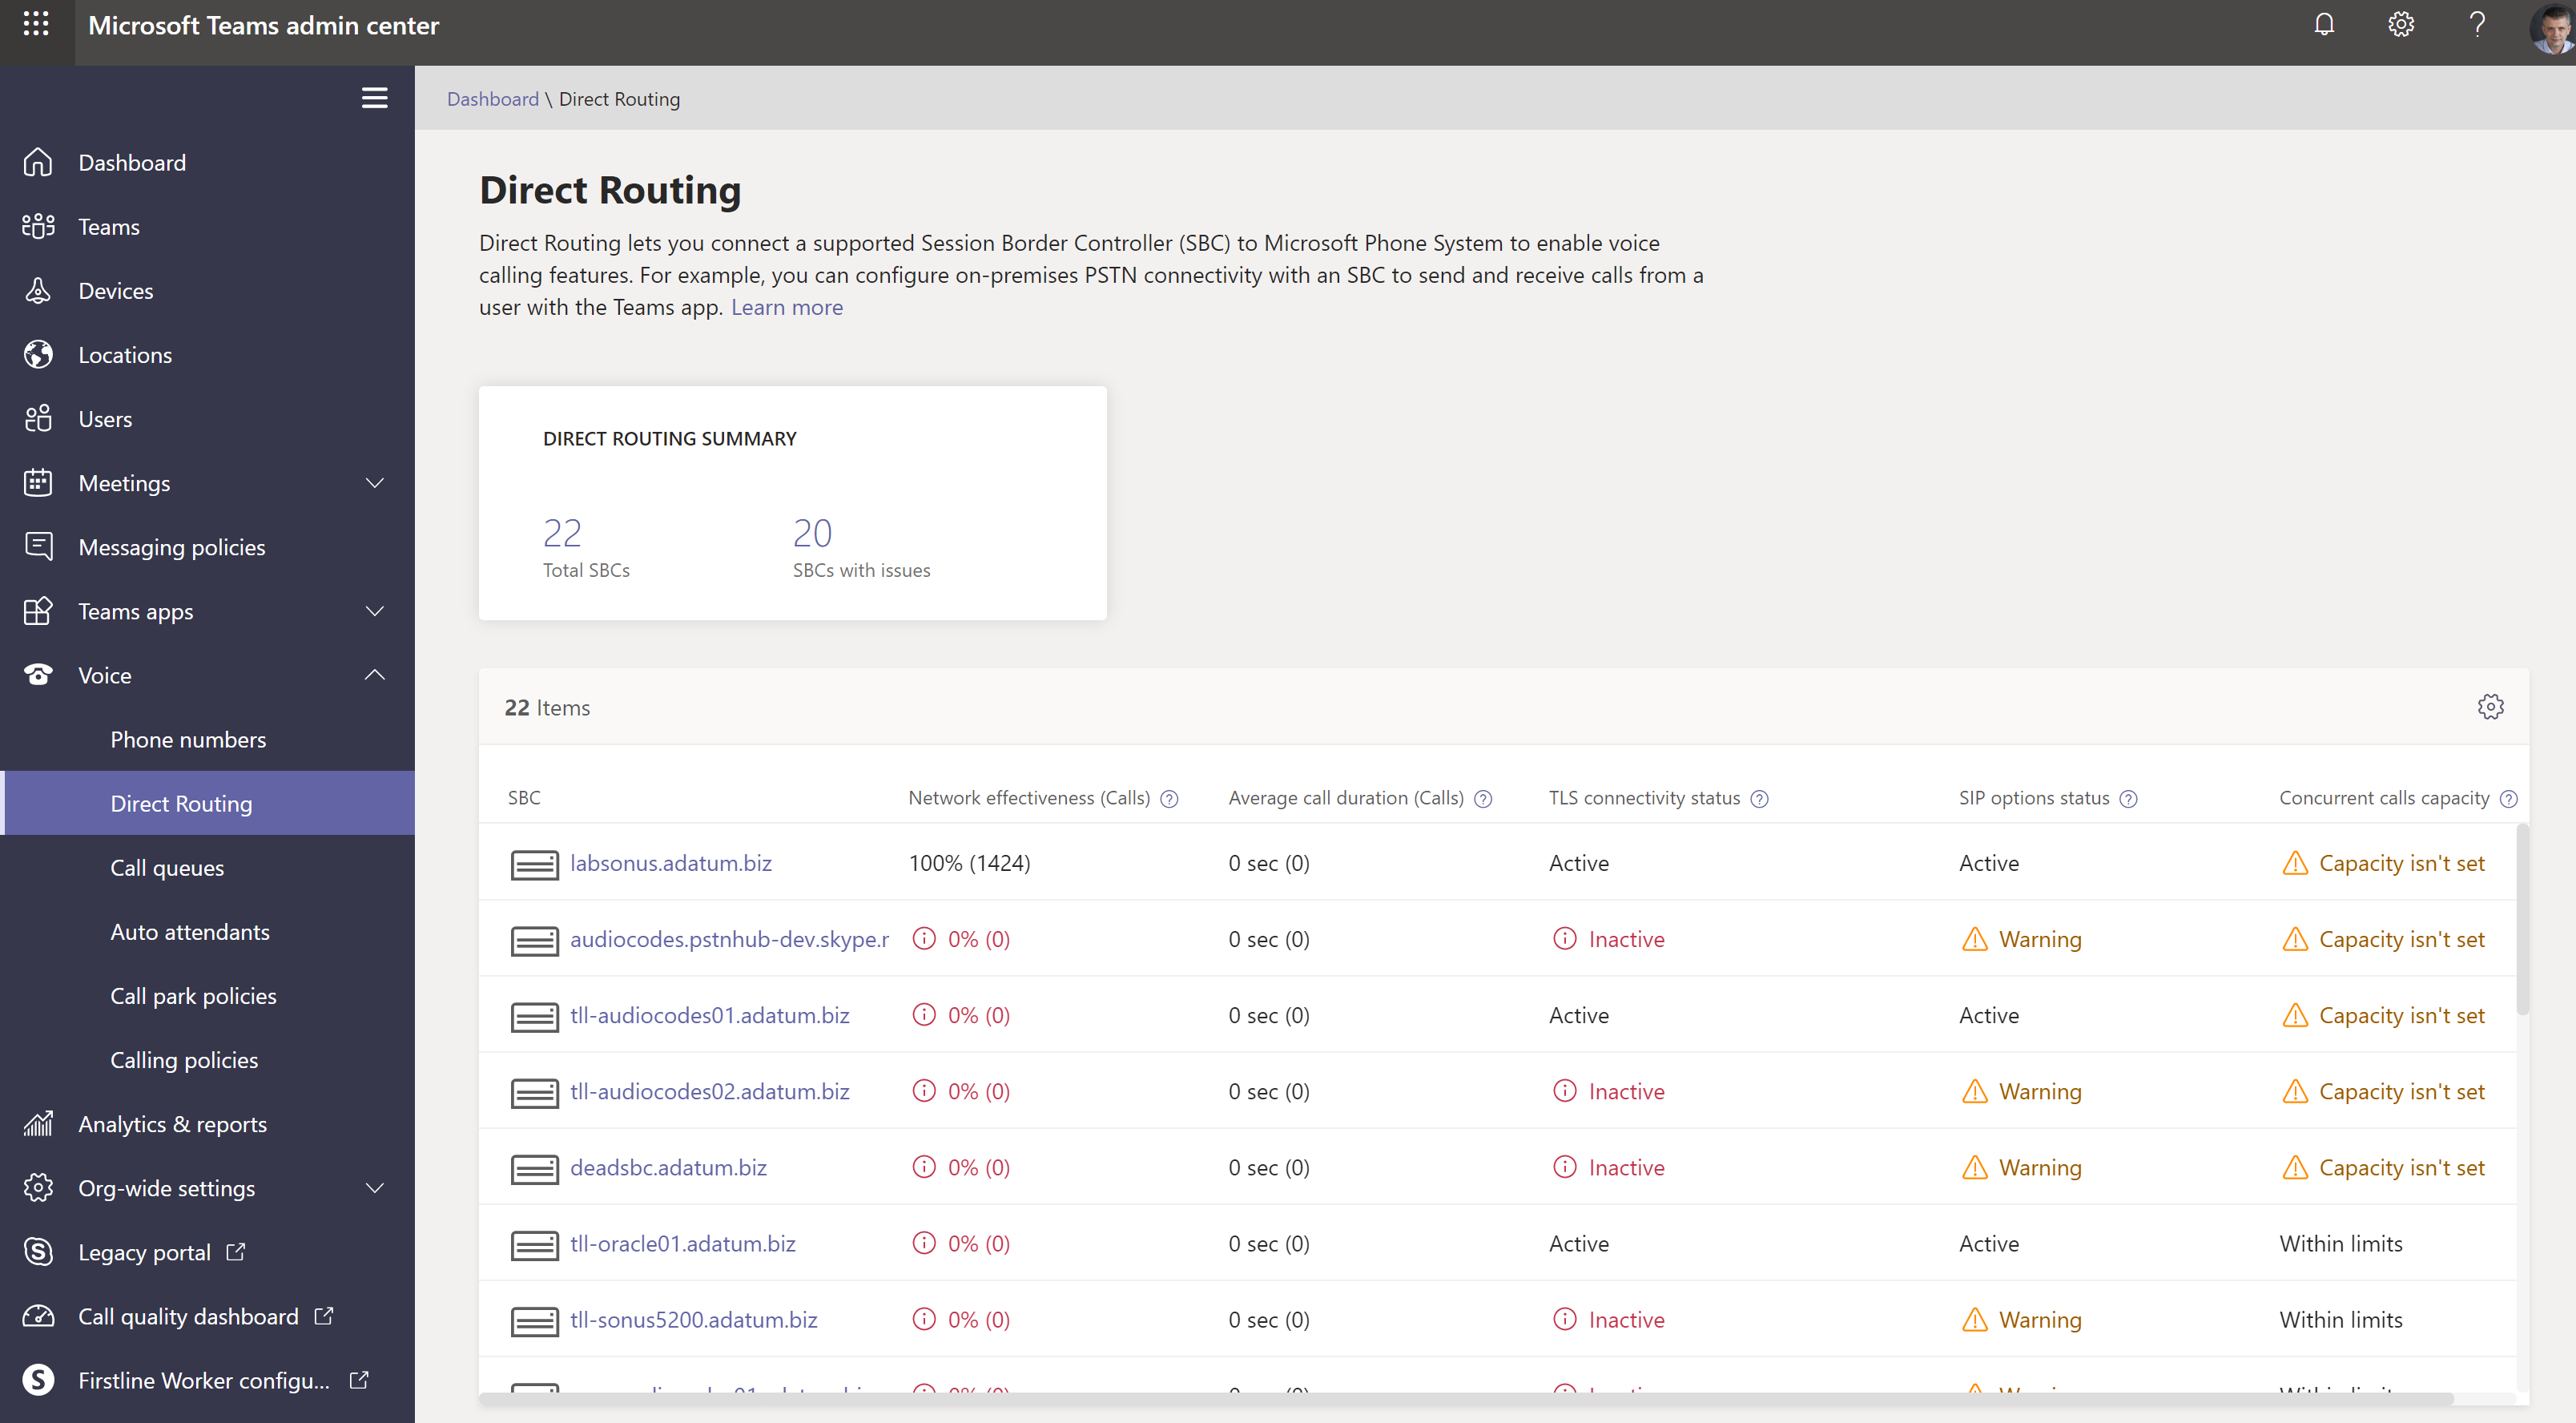
To give you an example of what you can expect to see when in the Teams admin center, you notice int he screen shot below that the monitoring checks specific aspects like:
- SBC
- SBC FQDN
- Network effectiveness
- The measured ability of the network to deliver a call relative to calls sent vs calls delivered
- Excludes call rejections by the far-end user (this is counted as a successful delivery)
- Formula: NER (Network Effectiveness Ratio) = Answered calls + User busy +Ring no answer + Terminal reject seizures x 100
- The measured ability of the network to deliver a call relative to calls sent vs calls delivered
- Average call duration
- Call duration can often help monitor the quality of the calls
- Shorter duration typically indicates quality issues
- Calls less than <15 sec typically mean something in the call went wrong and the user was forced to terminate the call
- Call duration can often help monitor the quality of the calls
- TLS connectivity status
- Shows the status of the TLS connection between the SBC and the Direct Routing Interface.
- Checks for certificate expiration on the SBC
- Gives warning when certificate is 30 days from expiring
- SIP option status
- Shows if there is an issue with SIP option flow. Also provides a detailed description of the errors
- Values for SIP options status messages are as follows:
- Active – Means SBC is active and the Direct Routing interface sees the options being delivered on a regular interval
- Warning, no SIP options – This means that the SBC is discoverable in the environment and is configured to send SIP options, but the Direct Routing service is not receiving SIP options coming back from the SBC
- Warning – SIP Messages aren’t configured – This means that the trunk monitoring for the SIP options is not enabled.
- Microsoft Calling System uses SIP options + TLS handshake monitoring to detect the health of the SBC at an application level
- If the trunk can be reached when pinging it, but the SBC certificate has expired or SIP stack doesn’t work properly, then Microsoft recommends enabling sending SIP options.
- Concurrent call capacity
- Calculates how many calls were sent/received by Direct Routing
- Use the New-CsOnlinePSTNGateway/ Set-CsOnlinePSTNGateway command along with the -MaxConcurrentSessions parameter
- Calculates how many calls were sent/received by Direct Routing

Image provided by: https://docs.microsoft.com/en-us/microsoftteams/direct-routing-health-dashboard
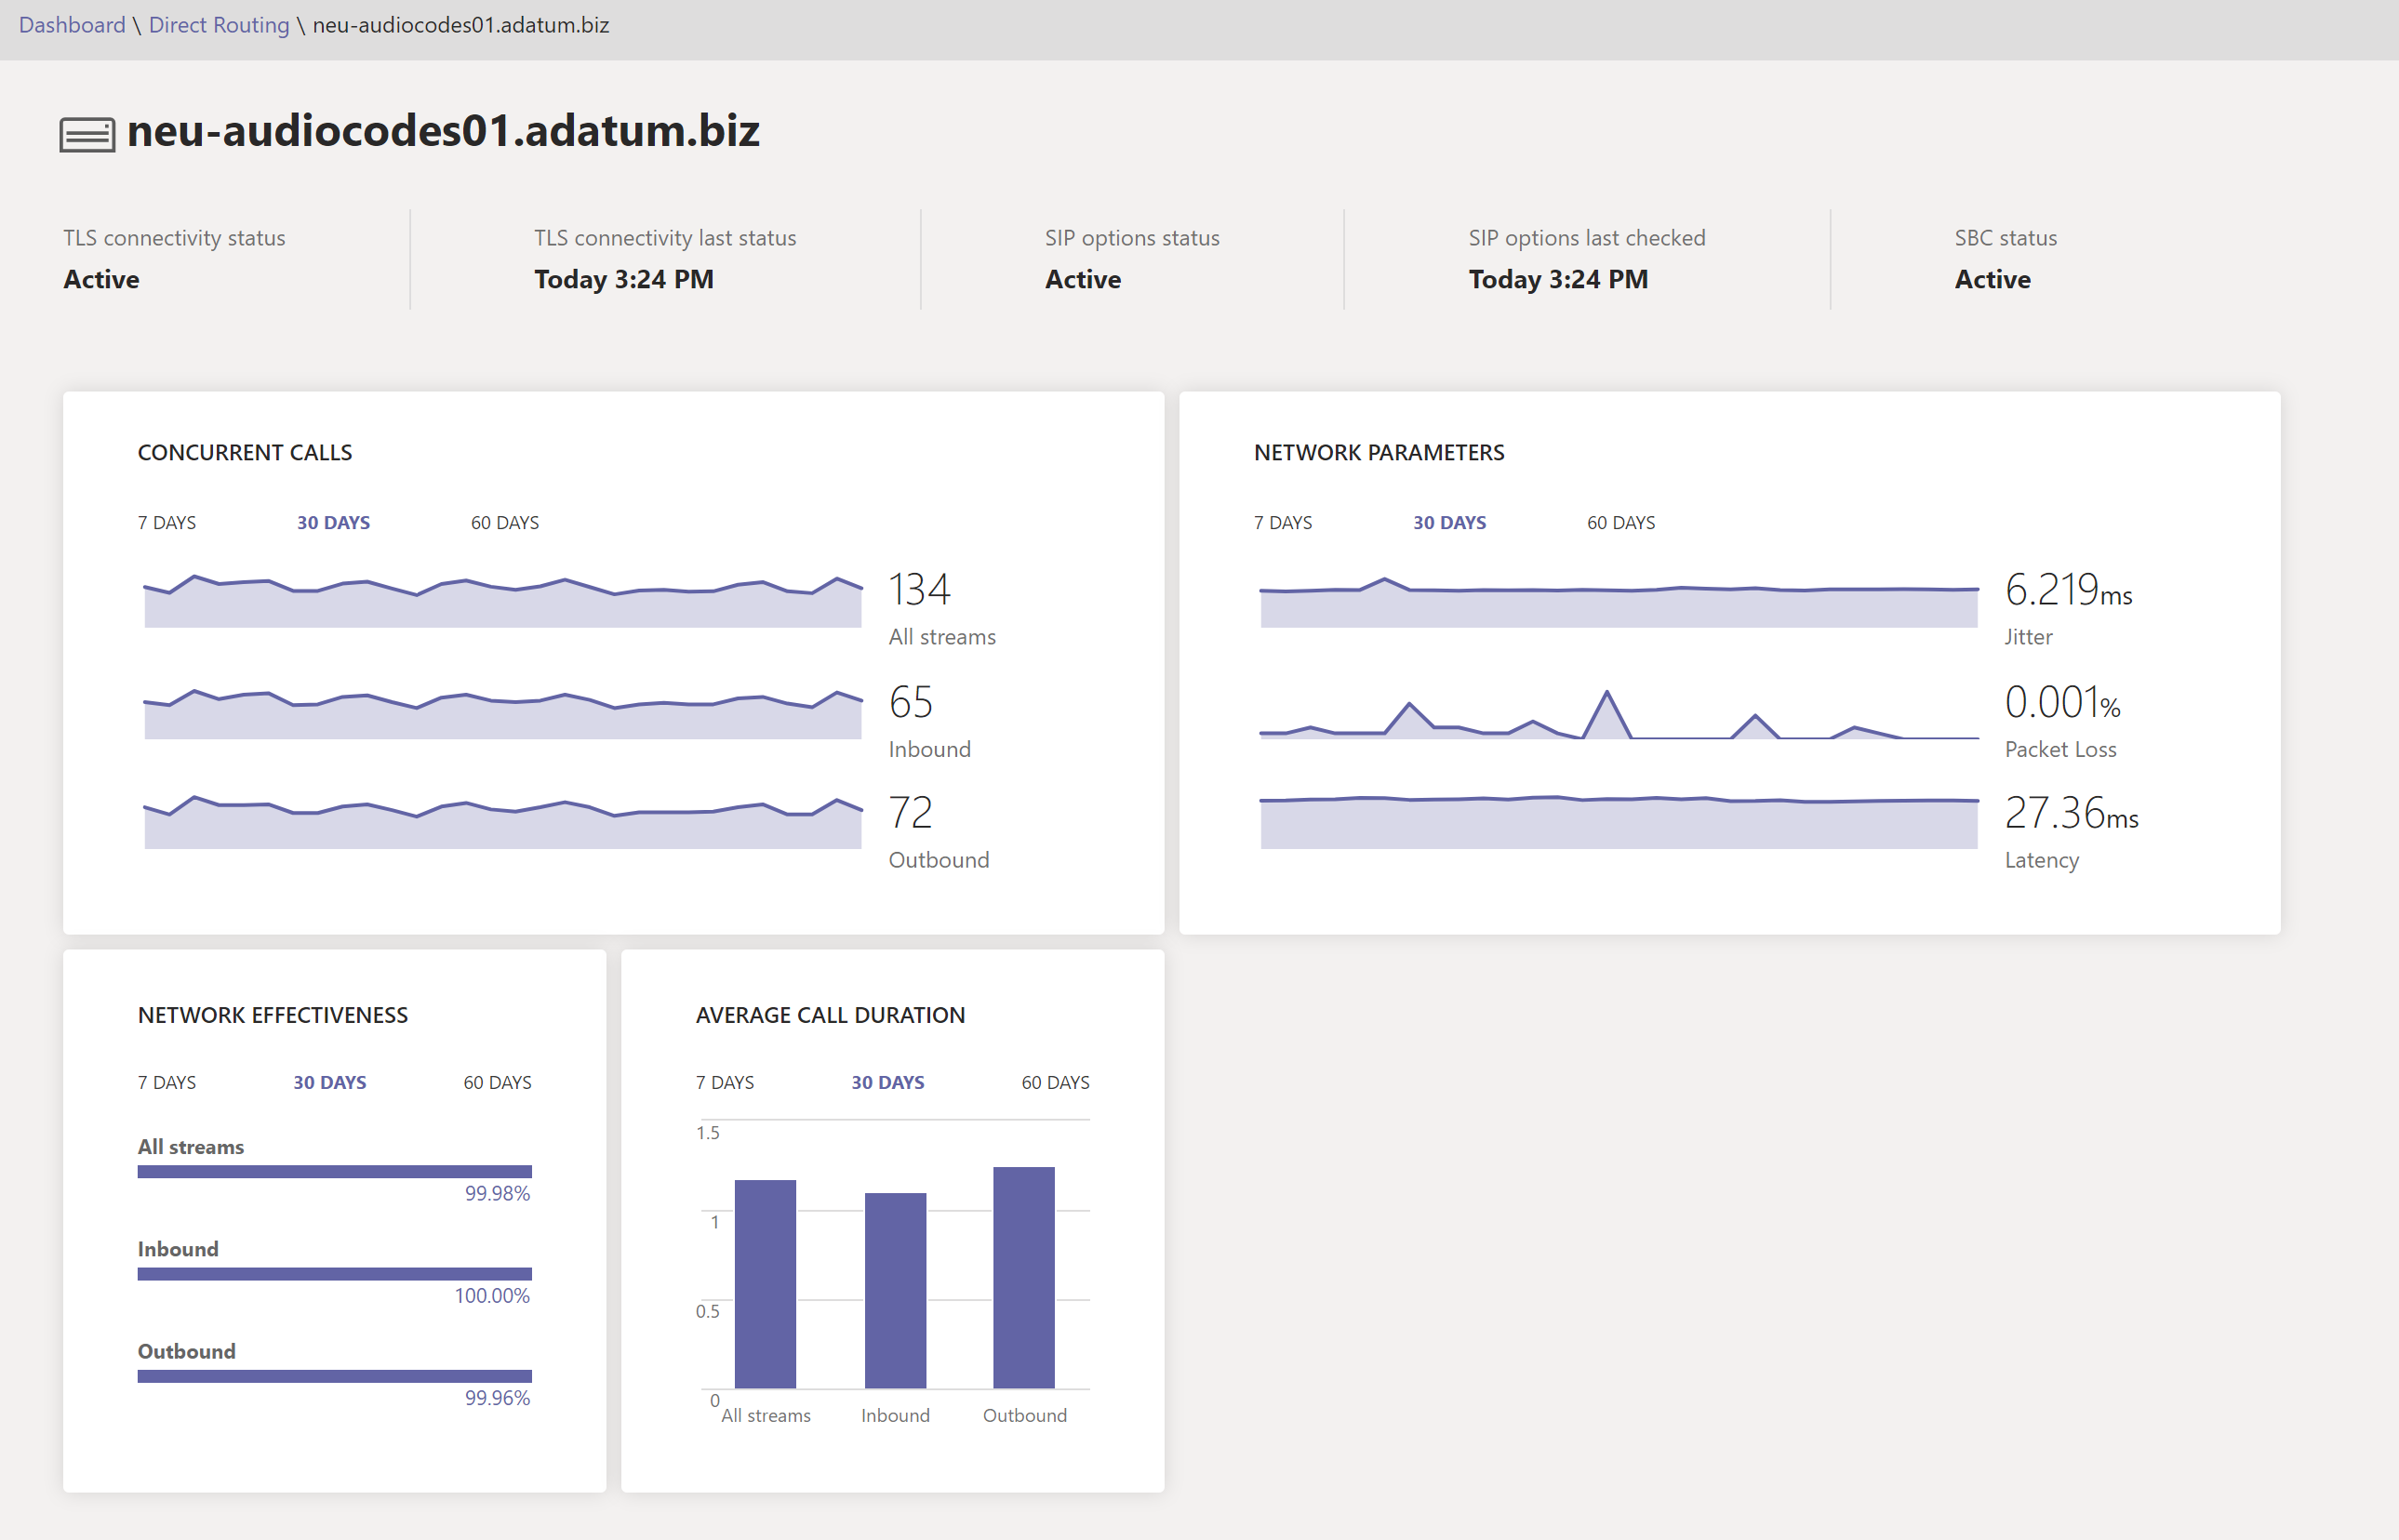
But wait, that’s not all….! You can dig even deeper by looking at the detailed view which will provide information on a specific SBC (as seen in the image below).

Image provided by: https://docs.microsoft.com/en-us/microsoftteams/direct-routing-health-dashboard
This detailed SBC view shows the following:
- TLS Connectivity status – Same metric as “Overall Health” page
- TLS Connectivity last status – Shows the last time when the SBC made a TLS connection to the Direct Routing service
- SIP options status – same metric as “Overall Health” page
- SIP options last checked – Shows the last time when SIP options were received
- SBC status – Current status of that particular SBC
- Concurrent call – Shows all concurrent calls being handled on that particular SBC
- You can filter on a 7 day, 30 day, or 60 day basis
- Provides metrics for inbound, outbound, and all streams
- Network parameters – Shows all network parameters measured from the Direct Routing interface to the SBC.
- The following metrics are measured:
- Jitter – Measures the variation in network propagation delay time between 2 endpoints that use RTCP in miliseconds (ms)
- Packet Loss – Measures packet arrival failure between 2 endpoints
- Latency/RTT – Length of time it takes for a signal to be sent + the time it takes for an acknowledgement to be received. Consists of propagation times between 2 points of a signal
- The following metrics are measured:
- Network Effectiveness ratio (NER) – Same parameter that appears on the “Overall Health” page
- Gives you the additional ability to filter data by time series or call direction
For a full breakdown of this new addition to the Teams admin center, you can checkout the official documentation here.

