It’s the typical issue all IT professionals face: a new system is designed, built and deployed to end users, but months down the road issues arise and administrators are faced with the overwhelming task of trying to find root cause to remediate issues. As an IT Pro (in a previous life) this is definitely something I can relate to and definitely pay attention to when discussing UC deployments with customers. Today at Ignite Microsoft announced some very new and very needed features for your Skype4B deployments. Admins rejoice!
Key Health Indicator Dashboard

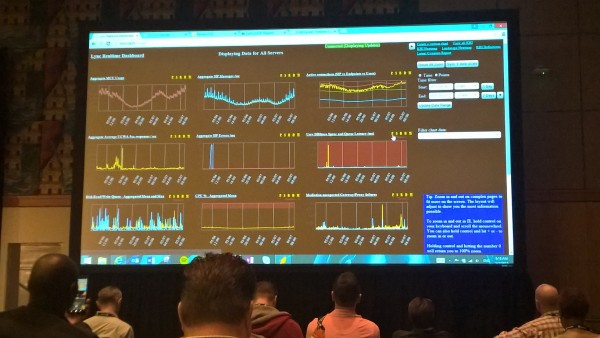
Those that have been following along with Skype4B news, many people know that the Call Quality Dashboard (CQD) has been announced to big fanfare (and rightfully so). A lesser known feature was unveiled today and that’s the Key Health Indicator Dashboard (the name isn’t finalized yet – so it may change!). This feature is very analogous to CQD in that it will be a web-based dashboard that provides real-time monitoring of KHI counters on your entire Skype4B topology. The dashboard will provide real-time data, drill down, heat maps and more. For anyone who has looked at KHI data previously, you know it is a very manual process that required taking CSV’s and then interpreting the data after-the-fact. The KHID will automate all of that and give you a single pane of glass to look at the server health statistics of your Skype4B environment. Microsoft is still working on this feature but from what I’ve seen so far, it is a huge improvement for admins.
Key Health Indicator Spreadsheet
As stated above, trying to gather KHI data is a very laborious, manual process. Creation of the CSV files with the perfmon data wasn’t so hard, but obtaining the MAX/AVG values and then importing that data into the KHI spreadsheet that Microsoft provided was entirely manual and time consuming, especially in environments that may have 20 or more servers. With the new release of the KHI spreadsheet, the CSV import and statistics gathering has become completely automated through macros in the new Excel spreadsheet – hallelujah! Additionally new insights into the data, such as Burst Counters, exist so that the data becomes more useful in identifying true issues and weeding out outliers that may occur during backup windows.
Third-Party Tool Integration
This can be stretched to many categories, including SDN, but it simply means that partners such as Nectar, EventZero, and Unify2 are providing solutions to make reporting and troubleshooting easier. Microsoft has provided some powerful utilities with the CQD, SSRS Reports, and KHI, but it often times requires multiple places to look and difficult correlation to establish to try and troubleshoot and resolve issues. These third-party utilities aim to provide a single pane of glass to the process and give you drill-down capabilities to help identify usage or why a user’s call failed or why jitter has increased on a certain network hop. These utilities actually rely on the same KHI or CQD data that Microsoft provides, they just present the data in new and interesting ways to allow you to better gauge usage and resolve issues.
Call Quality Dashboard
This new feature has been known for a few months but was recently released for GA on May 4, 2015. CQD simply takes the data that is already within your CDR and QoE databases and provides SQL Analysis Services to help slice and dice the data. If you’ve gone through the Call Quality Methodology before, CQD now allows you to look at that data in real-time (well, your QoE and CDR databases aren’t quite real-time, but close) and manipulate the data in ways that are important to YOU. If you find that a report offered within the SSRS reports isn’t quite enough for you, you can create a view within CQD that gives you the data you desire. Additionally if there are troubleshooting metrics that aren’t displayed in a friendly manner within SSRS, you can easily extract that data through CQD.
