A technology company has literally participated in thousands of projects over the years. At some point the group decided it wants to determine what factors or characteristics may influence the (hopefully successful) competition of current and future implementation projects. Thankfully, they have maintained records in on every project that they were involved in and that data contains the following (among other) informational fields:
- Project id – this is a unique internal project identifier
- Client– this is a flag field indicating if the client was a new or established client (Y/N)
- Contractors – this is a flag field indicating if non-employees were utilized on the project (compared to fulltime or salaried employees) (Y/N)
- Internal Project Manager – this is a flag field indicating if a fulltime internal project manager was assigned to the project (Y/N)
- Project Status – this is a flag field indicating if the project was completed successfully (on time, within budget) (Target)
- Technology Category -this is a flag field indicating if the core technology used for the project was an Established or Emerging technology
- Team Size – this is a continuous field that provides the number of full time team members assigned to the project (1, 2, 3…)
Opportunity for SPSS Modeler
The first step was to perform a simple data extract to create a file that I can import into Modeler (in this case, an industry standard CSV). I limited the extract to the fields I am interested in, but I could’ve used Modeler to exclude or filter the data:
Once I had my data, I created a modeling stream starting with the Modeler VAR FILE source node (the source node makes it easy to find a file, set some defaults and import the data into SPSS).
Typing
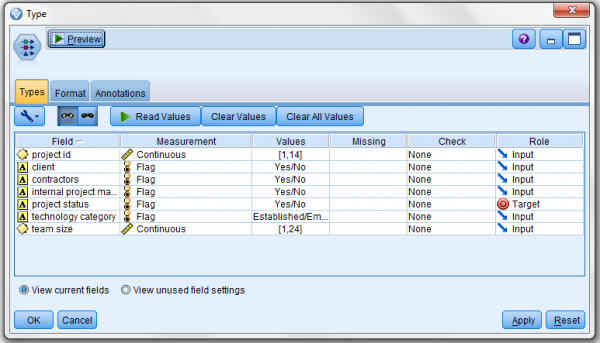
The next step is to add the very important Type node. The Type node is where you review each field in the file and set a level of measurement (like “Continuous” for the team size field and “Flag” for fields such as client and contractors) for each of the fields in the file. It also is where I select my Target field (in this case the target is “project status”).
Finally, we Model
After adding a SPSS Modeler node (CHAID) and connecting it to the Type node, I can run my stream.
When execution is finished, a “model nugget” is added to the Type node, and linked to the modeling node (sown as a dotted line). This link ensures that whenever the model is re-computed, the model nugget will be updated with the new results.
To see the model’s output, you can edit the model nugget (the output always depends on the models you run). First the summary tab confirms that the model target is the “project status” field and the inputs considered are the “client”, “contractors”, “technology category” and “team size” fields:
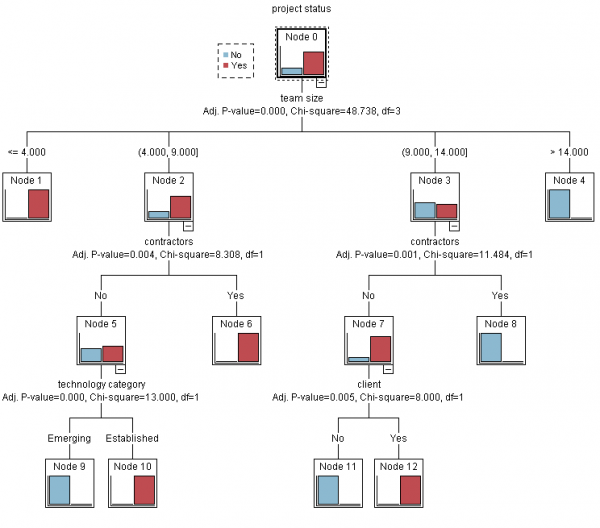
Next, the “Viewer” shows the model constructed tree showing the effects of the various inputs on the target. From this analysis, it would appear that the size of the team unquestionably affects the outcome of the project – and that to-date; the company is less effective as the size of the team increases.
Conclusion
This example illustrates just a single example of leveraging predictive analytics to improve performance in everyday business solutions. SPSS makes it easy!


