Recently, I attended the IBM Vision conference in Orlando. At the conference, I watched a presentation on what our friends at IBM are calling one of their “signature solutions”:
CFO Performance Insight.
This reminded me of various blog posts of mine, such as:
Reengineering the Forecasting Process with Predictive Models (Nov 2nd 2012)
and
Forecasting and Reporting with Cognos TM1 and SPSS (Oct 31st 2012)
Some Background
in the Vision session, Tom Levy (IBM Business Analytics) explained that fewer than 15% of CFO’s are confident that they currently are getting helpful information for making decisions about the future, yet more than 70% believe that the role of finance has been elevated into more of an advisory role in their enterprises agenda. In fact, the importance of activities such as measuring and monitoring enterprise performance has risen from about 69% in 2005 to over 85% in 2010 (according to the Global CFO Study conducted in 2010).
So, what have they done?
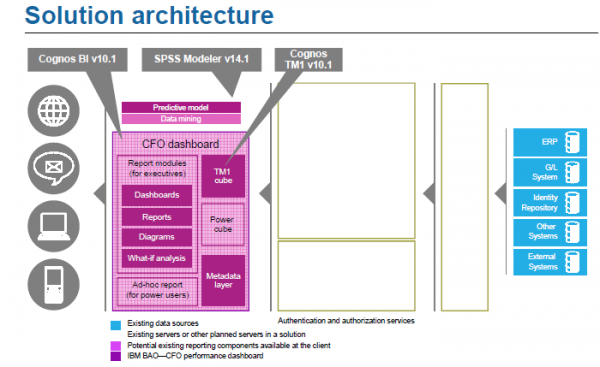
Based upon these particulars, IBM has utilized Cognos TM1, SPSS Modeler and Cognos BI to create a solution that basically utilizes TM1 as the OLAP data manager to capture and group performance information into targets for an organization, SPSS Modeler to automatically discover relationships between drivers and KPIs and use that information to create more reliable baseline forecasts and finally, use the power of Cognos BI to provide easy access to standard GL/AR/AP reports as well as “splashy” dashboards.
I was on track
Of course, there is a lot more to the IBM solution offered then I’ve mentioned in this post (you can read more online), but I was on the right track in my earlier posts – the idea of leveraging SPSS to take TM1 data to the next level.
So what questions can SPSS answer? How about:
Which metrics have the most impact on my performance?
Modeler can use historical data to discover those metrics that have the strongest impact on selected business objectives, directly or indirectly and evaluate the strength of user-specified metric Relationships.
How do metrics interact with each other?
Modeler can use historical data to discover significant causal relationships among metrics: time lag between metrics, strength, degrees of separation, etc.
What is driving performance?
Modeler can user identified causal relationships to automatically discover the metric values driving observed performances.
If nothing else changes, what will my future performance be?
Modeler can user causal-temporal model data to project future performance based on historical data.
I predict
It would be difficult (at best) to perform these types of studies manually. As the future unfolds, I predict we’ll see more and more solutions leveraging the IBM SPSS software suite.

