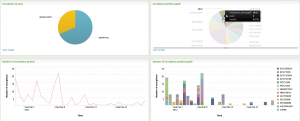
Splunk hosted a webinar earlier today on their Splunk for WebSphere Application Server 2.0 application. This is an application they wrote that extends Splunk’s already powerful capabilities to provide WebSphere-specific searches and reports.
If you’re not familiar with Splunk, you should take a look. In a nutshell:
Your IT infrastructure generates massive amounts of data. Machine data – generated by websites, applications, servers, networks, mobile devices and the like.
By monitoring and analyzing everything from customer clickstreams and transactions to network activity to call records, Splunk turns your machine data into valuable insights.
Troubleshoot problems and investigate security incidents in minutes (not hours, or days). Monitor your end-to-end infrastructure to avoid service degradation or outages. And gain real-time visibility into customer experience, transactions and behavior.
There are many questions that arise in typical WAS-based environments that this app will help answer, and answer very quickly. For example:
- A host needs to have an OS fix applied. Which applications are running on that host so I can test them after the fix is applied?
- The QA environment seems to be behaving differently today. What changes were made in WAS in the past 7 days? Were there any recent restarts? Who performed those actions?
- NOTE: This is great reason not to let multiple people use “wasadmin” or “wpsadmin” users. Assign groups to WAS administrative roles and make admins log in with their own account so their actions can be audited.
- There are a lot of errors and/or exceptions in the logs. Which ones occur the most so that I can prioritize their resolution? Are users seeing errors that correlate with errors being seen in the logs?
- Users are seeing intermittent failures on the site. Which of our cluster members are seeing the most exceptions or errors, or is it evenly distributed?
- Which of our hundreds of JVMs are running right now, and which are not?
WebSphere Application Server collects a great deal of information in logs and in memory (JMX, PMI, etc). This is the raw information that is needed to understand how the environment is operating. However, it’s hard to get to that information and consume it quickly, correlate it with other information, and then resolve problems based upon it. A few of the problems we see frequently are:
- Performance metrics and application logs are often not available to the people who are best suited to solve the problems. e.g. Developers don’t have access to production systems that contain the logs.
- It is very time-consuming for administrators to access each host and each log, then manually search them to find the problems. Generally not all logs are even inspected which means root cause exceptions might be missed.
- There may be a log monitoring agent installed, but it will often only look for particular regular expressions and will not provide context (the events occurring before and after the obvious error)
- Difficult to determine trends in problems. Is a particular exception new? Has there been a gradual or rapid increase in exceptions? Over what time period?
- Too many customers don’t map an LDAP group to the WAS administrative roles, so it’s impossible to determine who made WAS changes.
Splunk and their app for WAS help solve those problems by easily collecting logs, configurations, and performance metrics for centralized searching and reporting. The main classes of information it collects and reports on are:
- Component Inventory (cells, nodes, hosts, applications servers)

- Security
- Users
- Operational information (errors, configuration changes, and more)
- Performance (PMI metrics via JMX, such as database connection pool usage, thread pool metrics, etc)
- Solution Administration (information for the Splunk admins about the collection of WAS data)
If you already have a robust monitoring tool for your WAS environment (e.g. ITCAM, Introscope, New Relic, etc), that’s great – keep using it. Splunk will complement it by filling in gaps around monitoring configuration changes or logs. And if you don’t have a tool to monitor your WAS environment…well, you should, and Splunk is an excellent option to fill a lot of holes at once.
So how do you try this out?
- Download Splunk (it’s quick, and there’s a FREE version where you can index 500MB of data per day indefinitely)
- Install the Splunk for WebSphere Application Server 2.0 beta app. You can install just the app portion to Splunk if you are testing locally with a WAS instance on the same server with Splunk. This is perfect for a POC.
- Configure the app by following its setup screens and pointing to your local WAS environment.
- Use Splunk to learn more about and improve your WAS environment (a.k.a. “Profit!”)
The Splunk for WAS application was targeted for the base application server. But since IBM and other vendors have written a LOT of applications on top of WAS, this Splunk for WAS app is useful for those environments as well.
For example, WebSphere Portal logs by default to WAS’s log files (unless you enable tracing, in which case trace.log is also created). WebSphere Portal has its own set of informational, error, and audit events that it logs, and it will be fairly easy to set up additional dashboards in Splunk to report on those values. Similar principals will apply to WebSphere Process Server, WebSphere ESB, WebSphere Commerce, and many more.
Since Splunk has this handy app for WAS, it should make it relatively easy to build a Splunk for WebSphere Portal application. Hopefully that’ll be a future post.


Pingback: Splunking your WebSphere Application Server environment | Splunk Blogs
Pingback: Splunking your WebSphere Application Server environment | ALLBPI Net
I really like and appreciate your blog.Much thanks again. Really Great.
Great and Thanks for introducing me to this tool.
Hi, Its good to know this information, Do you have any experience/info on Integrating splunk with WSO2 servers, eg WSO2 Application Server http://wso2.com/products/application-server/