
Amazon Connect integrates with CloudWatch to provide monitoring capabilities for various contact center metrics. Here is an article providing more details: Monitoring Cloudwatch
In this blog post we add more details on some contact center metrics that are not yet documented, and how to trigger them.
As noted in the article, Amazon Connect integrates with CloudWatch metrics so that you can collect, view, and analyze CloudWatch metrics for your Amazon Connect virtual contact center. This allows you to monitor key operation Metrics via Dashboard or send Alarms to e-mail addresses.
Once my Amazon Connect instance was set up, I navigated to the Console and selected CouldWatch. Under the Alarm tab, there is an option to Create Alarm, which then presents a list of CloudWatch Metrics by Category with Connect Metrics being a separate category.
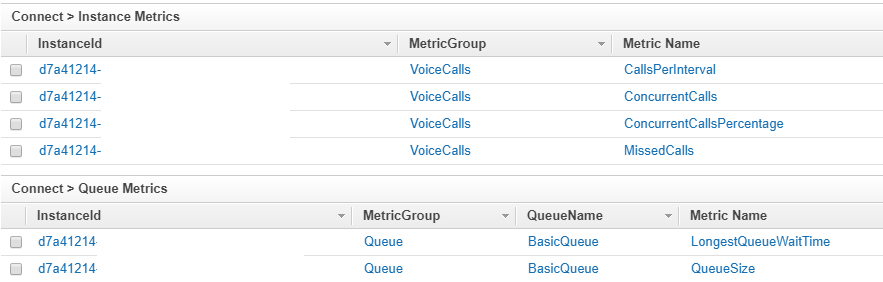
When I initially checked the available Alarm Metrics, I noticed there were only six alarm types, separated by level:
Instance level: CallsPerInterval, ConcurrentCalls, ConcurrentCallsPercentage, Missedcalls
Queue level: LogestQueueWaitTime, QueueSize
Screenshot of the initially available Alarm metrics:
I assumed some Alarm Metrics would appear later, and wanted to document what is necessary to make them appear in the list of Alarms.
Metrics definitions and findings by category:
ContactFlow Metrics
- ContactFlowErrors –This is the first Metrics that appeared during a random testing of the Lambda node which in case of Error would disconnect the call. I tried testing this alarm by forcing a Contact Flow to go to the error node, but no alarm was sent. The definition simply states: Represents the number of times the Contact flow branched to an ERROR label in the instruction.
- ContactFlowFatalErrors Despite various Lambda crashes and misconfigured contact flow testing, I have not been able to get this Alarm to appear in the list of Alarms. It seems that only a complete failure of the entire call flow could cause this.
- MisconfiguredPhoneNumbers – Definition: Represents the number of calls that failed because the phone number is not configured to a Contact flow. It is relatively easy to force this: simply claim a new Phone number and do not assign it to a Contact Flow. Calling the number will in this case result in a failed call. After about 10 minutes the unassigned number was created and called, the Alarm appeared in the list. While this Alarm is listed under Contact Flow metrics, it can only be selected on Instance level.
CallRecordings Metrics
- CallRecordingUploadError – Keep in mind you will not be able to enable recording on the Connect Dashboard or settings, but only on the instance level (Amazon Connect > Instance name > Data Storage). My instance was already configured for recording, but I had no Contact flow to set the recording using the Set call recording behavior node. This node does not have an error branch, so CloudWatch alarms are especially useful if the business needs require call recordings for each call. Once the Contact Flow was set up and the change had time to propagate (~15 minutes) the new alarm was present under Instance Metrics. Even though it is dependent on a Contact Flow, I believe it is a good thing to have the Alarm on Instance level – it would be a pain to have to create Alarms for each Flow, and not much can go wrong on the Contact Flow level so the instance and S3 bucket should be checked first in case this Alarm triggers, and only then the Contact Flows.
Queue Metrics
- QueueCapacityExceededError – Represents the number of calls rejected due to the queue being full. I have configured a Queue to have a maximum capacity of one contact and forced a call to fail due to the Queue being at capacity, but still no Alarm is present.
- QueueCallBackNonDialableNumber – Definition: Represents an error when the queue call back to a customer number is not dialable due to dialing profile restrictions. I managed to get Contact Flows to fail due to invalid callback numbers, but I haven’t been able to get this particular Alarm to appear.
- LongestQueueWaitTime – This Alarm is not defined in the Amazon article, but sounds self-explanatory: Longest Wait time in a certain queue.
- QueueSize – Also not defined in the article, I can only assume it refers to the number of Queued calls at a given time.

VoiceCalls Metrics
- MissedCalls – Represents the number of voice calls that were missed by the agents (not answered within 20 seconds). Very useful for ensuring the instance is within SLA.
- ConcurrentCalls – Represents the number of concurrent voice calls. Works really well as an Alarm but more importantly as a Dashboard metric.
- ConcurrentCallsPercentage – Represents the percentage of concurrent voice calls. ConcurrentCalls/ConfiguredConcurrentCallsLimit * 100.
- CallsBreachingConcurrencyQuota – Represents the number of voice calls that breached the Concurrency Quota configured threshold for the Amazon Connect instance. I have not been able to find any configurable threshold for this value and the Alarm is not appearing on CloudWatch. I assume this indicates the global limit of 100 Active calls per Instance specified under Amazon Connect limits: AWS Service Limits. This threshold can be increased via request to Amazon Support.
- ThrottledCalls – Definition: represents the number of voice calls that were throttled by the Amazon Connect Voice Service due to TPS/Callrate going beyond configured threshold for the Amazon Connect instance. Same as above, this Alarm is not present on my Alarm Metrics list.
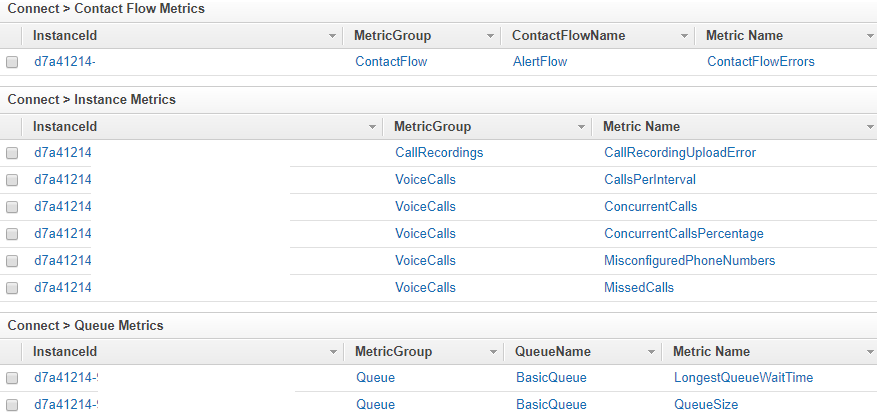
Screenshot of all available Alarm Metrics after a week and a lot of testing:
Creating Alarms
General information for setting up e-mail Alarms: Creating Amazon CloudWatch Alarms
Alarm recipients
The Actions under Define Alarm have multiple Notification options.
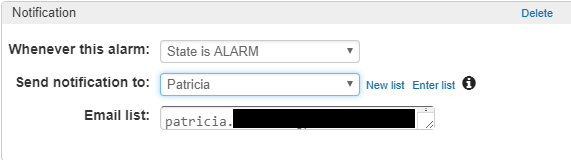
The first one determines when the Alarm will be sent and is called „Whenever this alarm:“. This allows you to select if you want to be notified when the State is ALARM, INSUFFICIENT or OK.
The second option will allow you to select the Alarm recipients. By default, the „Admin“ user from the Connect instance will be listed, and when selected the e-mail address of the user will automatically populate the Email list below:
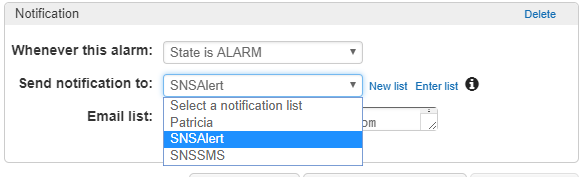
In case you want to notify multiple people at once, you can specify multiple recipients on the list, or use Amazon SNS (Simple Notification Service): Set Up Amazon SNS Notifications
This will allow you to send CloudWatch Alarms via e-mail to a specific list of recipients, called a Topic:
Monitoring Connect via CloudWatch Dashboard
All the Alarms described above can also be used as Metrics to be displayed on a Dashboard. To create it, simply navigate to Dashboards and select Create Dashboard: choose a name, widget type (Line, Stacked Area, Number or Text) and the Desired Metrics. I selected the Line widget and several Metrics and this was the result:
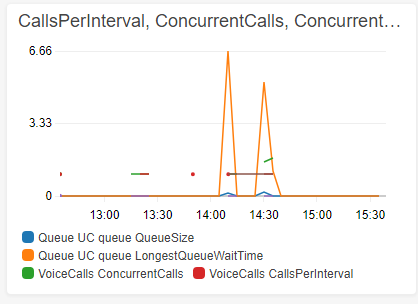
It is also possible to set an Interval refresh on 1, 2, 5 or 10 minutes, or Automatic refresh.
Conclusion
During my week of testing, I went from having 6 Alarm Metrics on the list to having 11. The fact that certain Alarm Metrics only appear after a behavior or issue has been experienced is certainly an interesting behavior, as I would assume users would like to enable Alarms before certain issues happen.
The Alarms themselves are very useful, get delivered quickly and allow you to take necessary action.
The Dashboard is highly customizable in both view and Metrics which makes it easy to see the status of the Call center at a glance.
I hope the suggested steps will allow you to force the Alarms to appear before moving into production. I’d like to hear your experience and if you found any additional metrics that I wasn’t able to cover in this blog post.
If you’re interested to see more, schedule a demo or contact us here.
Hi, How to retrieve the Cloud watch amazon connect metrics in Lambda. Can you provide the sample code. Thanks in Advance