Introduction
One of the big drivers of adopting containers to deploy microservices is the elasticity provided by platforms like Kubernetes. The ability to quickly scale applications up and down according to current demand can cut your spending by more than half, and add a few 9s to your SLAs. Because it’s so easy to setup nowadays, there’s really no good reason for autoscaling not to be one of your top priorities for a successful adoption of Kubernetes. In this post I’m going to give you the 6 easy steps to establish a solid autoscaling foundation using KEDA, and trust me you’ll go a long way with just these basic principles.
TL;DR
- Rightsize your deployment container
- Get a performance baseline for your application
- Use the baseline measurement as a the KEDA ScaledObject target
- Test your KEDA configuration with realistic load
- Refine the metric to minimize the number of pods running
- Iterate
Understand these principles
Before you jump into autoscaling, please consider the following
- Autoscaling is not a silver bullet to solve performance problems
- “Enabling HPA is not the same as having a working autoscaling solution” (credit: Sasidhar Sekar)
- It’s a powerful tool that needs to be used with caution, bad configuration can lead to large cost overruns
- Autoscaling is better suited for non-spiky load patterns
- Autoscaling tuning can be different for each application
- Tuning requires a solid understanding of traffic patterns, application performance bottlenecks
- Sometimes it’s good to not auto-scale (you might want backpressure)
- Careful with async workloads
- Think about the whole system, external dependencies, tracing is invaluable
- Tuning autoscaling is a process, to be refined over time
Now that we got out of the way, let’s get started…
Autoscaling options
Let’s super quickly review the different types of autoscaling available for Kubernetes:
Vertical Autoscaling: resizes individual pods to increase the load capacity. Great for rightsizing applications that don’t scale horizontally easily such as Stateful services (databases for example) or applications that are CPU or memory bound in general. Scaling a pod vertically requires replacing the pod, which might cause downtime. Note that for certain type of services, resizing a pod might have no effect at all on its capacity to process more requests. That’s because Spring Boot services for example have a set number of threads per instance, so you would need to explicitly increase the number of threads to leverage the additional CPU.
Horizontal Autoscaling: creates additional identical pods to increase the overall load capacity. Best option to use whenever possible in order to optimize pod density on a node. Supports CPU and memory-based scaling out-of-the-box but supports custom metrics as well. Well-suited for stateless services, event-driven consumers
Node Autoscaling: creates additional identical nodes (machines) in order run more pods when existing nodes are at capacity. This is a great companion for horizontal autoscaling but… there are many considerations to take into account before turning it on. The two main concerns are waste – new nodes might get provisioned for only minor capacity increase – and scaling down – when nodes run Stateful pods which might be tied to specific zones.
The rest of this article will be focused on horizontal pods autoscaling.
Understanding the Horizontal Pod Autoscaler
HPA ships with Kubernetes and consist of a controller that manages the scaling up and down of the number of pods in a deployment.
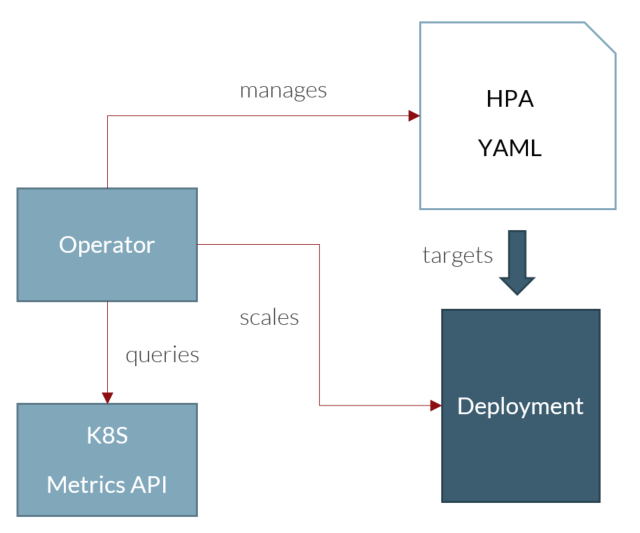
In a nutshell:
- You create a manifest to configure autoscaling for one of your deployments
- The manifests specifies what metric and threshold to use to make a scaling decision
- The operator constantly monitors the K8s metrics or some metrics API
- When a threshold is breached, the operator updates the number of replicas for your deployment
HPA is limited in terms of what metrics you can use by default though: CPU & memory. So this is fine if your service is CPU or memory bound but if you want to use anything else, you’ll need to provide HPA with a custom API to serve other types of metrics.
This is the basic formula that the HPA to calculate the desired number of pods to schedule:
desiredReplicas = ceil[currentReplicas * ( currentMetricValue / desiredMetricValue )]
This is calculated on every “tic” of the HPA, which can be configured per deployment but default to 30 seconds.
Example:
An HPA configured with a target CPU usage of 60% will try to maintain an average usage of 60% CPU across all deployment’s pods.
If the current deployment is running 8 pods averaging %70 usage, desiredReplicas = ceil[8*(70/60)] = ceil(9.33) = 10. The HPA will add 2 pods.
Introducing KEDA
According to the KEDA website:
KEDA is a Kubernetes-based Event Driven Autoscaler. With KEDA, you can drive the scaling of any container in Kubernetes based on the number of events needing to be processed.
That’s actually a bit misleading and reducing. The common misconception is that KEDA can only be used when doing event-driven architecture like MQ or Kafka. In reality KEDA provides that API I mentioned earlier for serving custom metrics to the HPA. Any type of metrics, like response time or requests/second, etc

So say you want to use Prometheus metrics, or CloudWatch metrics, etc. KEDA has a lot of scalers to integrate with all these services. This is a very easy way to augment the default HPA and not write custom metrics APIs.
KEDA Workflow
- A ScaledObject Kubernetes manifest tells KEDA about your deployment and desired scaling configuration
- KEDA initially scales down the deployment’s pod to 0
- When pod activity is first detected, KEDA scales the deployment to the min number of pods specified in the config file
- KEDA also creates a native Kubernetes HorizontalPodAutoscaler (HPA) resource
- The HPA monitors the targeted metric for autoscaling by querying a KEDA metric server
- The KEDA metric server acts as a broker for the actual metric server (Azure Monitor, App Insight, Prometheus, etc)
- When the metric threshold is breached, the HPA adds more pods according to the formula below
- When no more traffic is detected, the HPA scales back the pods down to the min number of pods
- Eventually KEDA will scale back down to 0 and de-activate the HPA
A note about HTTP services
One of the interesting features of KEDA is the ability to scale down to 0 when there’s nothing to do. KEDA will just query the metric system until activity is detected. This is pretty easy to understand when you’re looking at things like queue size of Kafka records age, etc. The underlying service (i.e. Kafka) still runs and is able to receive messages, even if there aren’t any consumer doing work. No message will be lost.
When you consider HTTP services though, it doesn’t work quite the same. You need at least one instance of the service to process the first incoming HTTP request so KEDA cannot scale that type of deployment to 0.
(There is an add-on to handle HttpScaledObjects that creates a sort of HTTP proxy, but if you really need to scale down services to 0, I recommend looking at KNative instead)
You can still leverage KEDA as the HPA backend to scale on things like requests/seconds and this is what we’re going to do next.
Rightsizing your application pods
What we call rightsizing in Kubernetes is determining the ideal CPU and Memory requirements for your pod to maximize utilization while preserving performance.
Rightsizing serves 2 main purposes:
- Optimize the density of pods on a node to minimize waste
- Understand your application capacity for a single pod so we know when to scale
Optimizing density
This is more related to cost control and utilization of compute resources. If you picture the node as a box, and the pods as little balls, the smaller the balls, the less wasted space between the balls.
Also you’re sharing the node with other application pods, so the less you use, the more resources you leave to other applications.
Let’s walk through an example. Say your node pools are made of machine with 16 vCPUs and your pods are configured to request 2 vCPUs, you can put 8 pods on that node. If your pod actually only uses 1 vCPU, then you’re wasting 50% capacity on that node.
If you request a big vCPU number, also keep in mind that every time a new pod comes up, you might only use a fraction of that pod capacity while usage goes up. Say your pod uses 4 vCPU / 1000 concurrent requests. At 1250 requests for example, a new pod would be created, but only ¼ of the requested vCPU would be used. So you’re blocking resources that another application might need to use.
You get the idea… smaller pods = smaller scaling increment
Understanding performance
This is to give us a baseline for the metrics to scale on. The idea is to establish a relation between the pod resources and its capacity to reach a target so multiply by 2 and you can twice the capacity, multiple by 3 and you get 3 times the capacity etc.
I recommend using a performance-based metrics for autoscaling as opposed to a utilization metric. That’s because a lot of http services don’t necessarily use more resources to process more requests. Checkout the following load test of a simple Spring Boot application.

In this test I’m doubling the number of concurrent requests at each peak. You can see that the max CPU utilization doesn’t change.
So what’s the right size? In a nutshell, the minimum CPU and memory size to insure a quick startup of the service and provide enough capacity to handle the first few requests.
Typical steps for a microservice with a single container per pod (not counting sidecar containers which should be negligible):
- To determine the initial CPU and memory requests, the easiest approach is to deploy a single pod and run a few typical requests against it. Defaults depend on the language and framework used by your application. In general, the CPU request is tied to the response time of your application, so if you’re expecting ~250ms response time, 250m CPU and 500Mi memory is a good start
- Observe your pod metrics and adjust the memory request to be around the memory used +- 10%.
- Observe your application’s startup time. In some cases, requests impact how fast an application pod will start so increase/decrease CPU requests until the startup time is stable
Avoid specifying CPU limits at least at this point to avoid throttling
To really optimize costs, this will need to be refined over time by observing the utilization trends in production.
Getting a performance baseline
This step measures how much load a single pod is able to handle. The right measure depends on the type of services that you’re running. For typical APIs, requests/seconds is the preferred metric. For event-driven consumers, throughput or queue-size is best.
A good article about calculating a performance baseline can be found here: https://blog.avenuecode.com/how-to-determine-a-performance-baseline-for-a-web-api
The general idea is to find the maximum load the pod can sustain without degradation of service, which is indicated by a drop in response time.
Don’t feel bad if your application cannot serve 1000s of RPS, that’s what HPA is for, and this is highly dependent on your application response time to begin with.
- Start a load test with a “low” number of threads, without a timer, to approximate your application response time
- Now double the number of threads and add a timer according to the formula in the above article
- Observe your application average response time
- Repeat until the response time goes up
- Iterate until the response time is stable
- You now have your maximum RPS for a rightsized pod
Keep an eye on your pod CPU utilization and load. A sharp increase might indicate an incorrect CPU request setting on your pod or a problem inside your application (async processes, web server threading configuration, etc)
Example: REST Service expecting 350ms response time
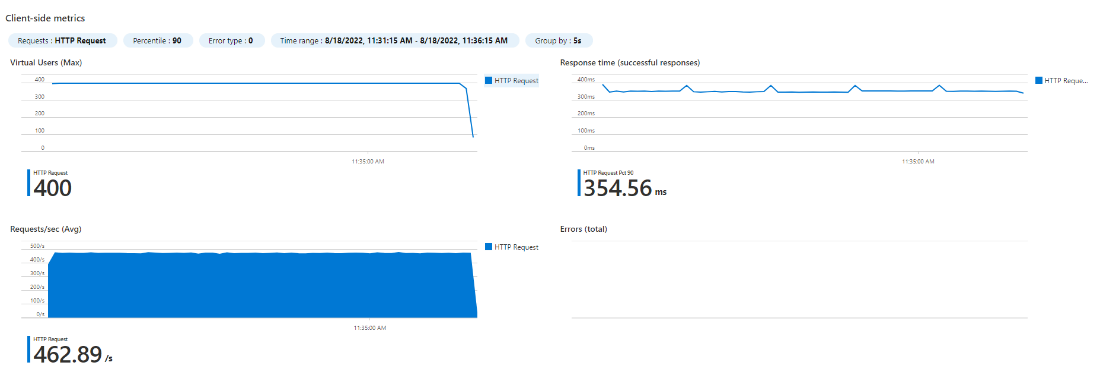
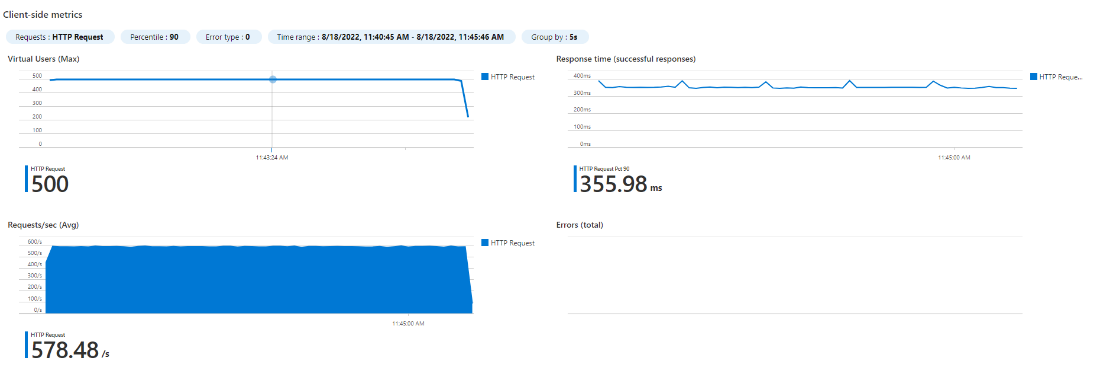
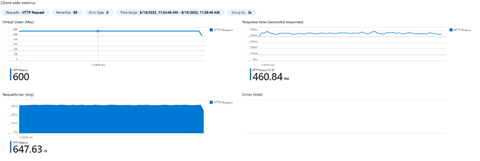
We rightsized our Spring Boot application and chose 500m CPU and 600Mi memory requests for our pod. We’ve also created a deployment in our Kubernetes cluster with a single replica. Using JMeter and Azure Load Testing we were able to get the following results. The graphs show number of concurrent threads (users) on the top left, response time on the top right, and requests/seconds (RPS) on the bottom left.
| 1 POD (500m CPU) – 200 users
|
1 POD (500m CPU) – 400 users
|
| 1 POD (500m CPU) – 500 users
|
1 POD (500m CPU) – 600 users
|
Observe the response time degrading at 600 users (460ms vs 355ms before). So our pod performance baseline is 355ms @ 578 rps (500 users).
Interestingly, the CPU load plateaued at around 580 RPS. That’s because Spring Boot rest services are typically not CPU bound. The requests are still accepted but land in the thread queue until capacity is available to process the request again. That’s why you see an increase of the response time despite the CPU load staying the same. This is a perfect example of why using CPU for autoscaling doesn’t work sometimes, since in this case, you would just never reach a high CPU utilization. We still want the CPU request to be higher because of startup time for Spring Boot apps.
Now let’s scale our deployment to 2 replicas and run the tests again.
| 2PODS (500m CPU) – 1000
|
2 PODS (500m CPU) – 1200 users
|
This confirms our baseline so we know we can double the number of pods to double the capacity (353.11ms @ 1.17 rps)
Configuring KEDA
I’ve previously explained that the HPA only supports CPU and memory metrics for autoscaling out-of-the-box. Since we’ll be using RPS instead, we need to provide the HPA an API to access the metric. This is where KEDA comes in handy.
KEDA provides access to 3rd party metrics monitoring systems through the concept of Scalers. Available scalers include Azure Monitor, Kafka, App Insights, Prometheus, etc. For our use case, the RPS metric is exposed by our Spring Boot application through the Actuator, then scraped by Prometheus. So we’ll be using the Prometheus scaler.
The ScaledObect resource
In order to register a deployment with KEDA, you will need to create a ScaledObject resource, similar to a deployment or service manifest. Here’s an example:
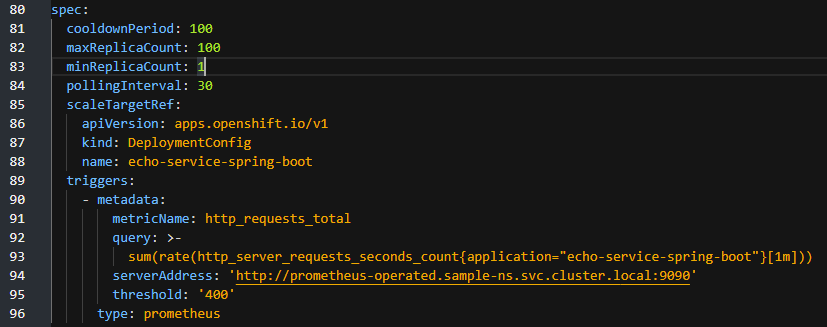
Let’s discuss the main fields:
- minReplicaCount is the number of replicas we want to maintain. Remember in the case of an HTTP service, we always want at least one at all time (see discussion above)
- scaleTargetRef is a reference to your deployment resource (here we’re using Openshift DeploymentConfig, but normally you’d target a Deployment)
- metadata.type indicates that we want to use the Prometheus scaler
- metadata.query specifies the PromQL query to calculate the average RPS across all pods tagged with “echo-service-spring-boot”
- metadata.threshold is the target for the HPA. Remember the formula at the beginning of the post “desiredMetricValue”, this is it
- metadata.metricName is whatever you want and has to be unique across scalers
That’s pretty much it. Apply that resource to the namespace where your deployment is running and you can start testing
Tuning Autoscaling
Let’s first look at the basic steps and we’ll discuss details down below:
- Start with 1 minReplicaCount
- Start your test
- Observe the response time graph
- If things are configured properly, we expect the response time to remain constant as the number of RPS increases
- Increase the threshold until you start seeing spikes in response time, which would indicate that the autoscaler is scaling too late
- If the ramp-up time is too short, you will see a spike in response time and possibly errors coming up
- Change minReplicaCount to at least 2 for HA but match real-world normal traffic expectations
Understanding timing
Pay attention, this part is very important: always test for realistic load. Testing with a ramp-up of 10k users/s is probably not realistic and most likely will not work. Understanding your traffic patterns is critical.
Remember that the various components in the autoscaling system are not real-time. Prometheus has a scrapping interval, the HPA has a query interval, KEDA has a scaling interval, and then you have your pod startup time, etc. This can add up to a few minutes in the worst case scenario.
During load increase, only the current number of pods will be able to handle the incoming traffic, until KEDA detects the breach of threshold and triggers a scaling event. So you might experience more or less serious degradation of service until your new pods come up. Can your users tolerate a few seconds of latency? Up to you to decide what’s acceptable.
Example:
Let me try to illustrate what’s going on. Imagine an application which can serve 5 RPM and we set our autoscaling threshold to 4 RPM, and we configure our test with 10 threads and a ramp up time of 150 seconds, this means we have a ramp-up rate of 4 threads per minute. We calculated that it’d would take 1.5 min for KEDA to trigger a scale up, and for a new pod to be ready to receive requests. We can trace the following graph:
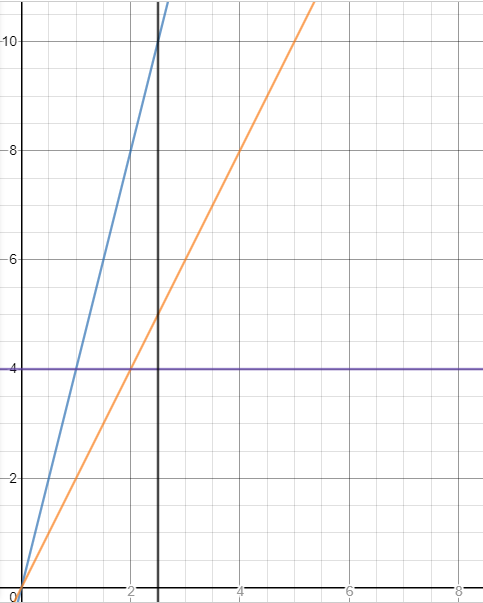
In blue we show the number of users/min simulated by our load test, in orange, the capacity of a single pod and in purple, the threshold set in the autoscaler.
At the 1 minute mark, the threshold will be breached (blue line crossing), so 1.5 minutes after that – in the worst case – our second pod will be ready at the 2.5 minutes mark.
The vertical black line shows that the number of users at the 2.5 min would have already reached 10 so the single first pod will have to deal with up to 2x its RPM capacity until the second pod comes up.
We know our application can handle up to 5 RPS without service degradation, so we want to configure our tests so the ramp-up rate falls under the orange line. That’s a 2 threads/min ramp-up, hence we need to increase our ramp-up time in JMeter to 300 seconds and make sure our overall test duration is at least 300 seconds.
Tuning the threshold
In our previous example, what if your actual ramp-up in production is just that high? Before messing with the threshold, try this first:
- Decrease your pod startup time
- Decrease the autoscaler timers (not super recommended)
- Improve your app performance so the RPS goes up
- Be OK with slower response times for a short time
If none of that helps you achieve your goal, you can try lowering the threshold BUT you need to understand the tradeoffs. Let’s go back to our formula:
desiredReplicas = ceil[currentReplicas * ( currentMetricValue / desiredMetricValue )]
You can see that the number of pods is directly related to the ratio between the threshold and the actual load. Now let’s say you want to handle a load of 1000 RPS.
If you set the threshold to 1000 RPS, the HPA will scale to 10 pods. Now, change the threshold to 50 RPS and the HPA will scale to 20 pods – i.e. twice the amount of pods – for the same load and same pod capacity!
A lower threshold will result in more pods for the same load, which will increase cost, waste resources (under-utilized pods) and potentially impact overall cluster performance. At the same time a lower threshold will result in less risk of degraded service.
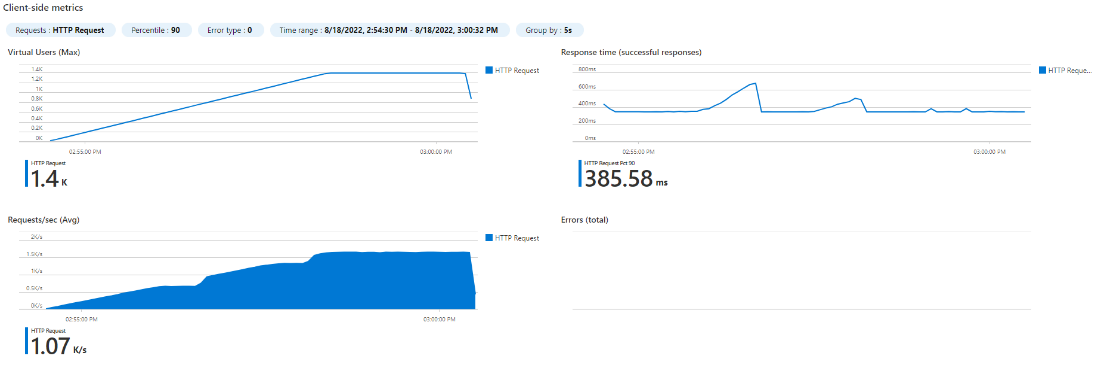
Example of autoscaling based on our previously tested REST API
| Autoscaled – 1400 users – 120 seconds ramp-up – 500 rps threshold
Ramp-up time is too short and threshold is too high, resulting in a serious increase in response time for the first couple pods |
Autoscaled – 1400 users – 240 seconds ramp-up – 500 rps threshold
Double ramp-up time, still small spike in response time but better overall |
| Autoscaled – 1400 users – 240 seconds ramp-up – 400 rps threshold
Decreased threshold improves response time degradation |
Autoscaled – 1400 users – 240 seconds ramp-up – 300 rps threshold
Lower threshold improved response time even more BUT… |

HPA scales to 4 pods @ 400 RPS threshold |

HPA scales to 6 pods @ 300 RPS threshold |
In this case, we determined that 400 RPS was the correct threshold to avoid overly degraded response time during initial scale-up while maximizing resource utilization.
Impact of application performance problems in production
Autoscaling a part of a system means making sure the other parts can scale too
If an application response time starts increasing significantly, autoscaling can become a big problem if you’re not using the right metric.
A misconfigured autoscaler can result in much higher costs without benefit and negatively impact other systems.
For example, if an application becomes really slow because of a downstream problem with a database, adding more pods will not improve the situation. In some cases, that would actually aggravate the problem by putting more pressure on the downstream system.
A drop in response time would mean a drop in RPS. By using RPS as the scaling metric, in that case, we would actually decrease the number of pods to match what the system is actually capable of serving. If you instead scaled on response time, the number of pods would increase but the throughput would remain exactly the same. You’d just have stuck requests spred out across more pods.
Monitoring key metrics is critical to avoid runaway costs
Monitor HPA, understand how often pods come up and down and detect anomalies like unusually long response times. Sometimes autoscaling will mask critical problems and waste a lot of resources.
Improve your application’s resilience first
Sometimes it is actually better to not autoscale when you want back-pressure to avoid overwhelming downstream systems and provide feedback to users. It’s a good idea to implement circuit breakers, application firewalls, etc to guard against these problems
Continuous improvement
Autoscaling tuning CI/CD
All the steps above can be automated as part of your CI/CD pipeline. JMeter and Azure Load Tests can be scripted with ADO and ARM or Terraform templates.
This is to proactively track changes in application baseline performance which would result in changing the target value for the autoscaling metric.
You can easily deploy a temporary complete application stack in Kubernetes by using Helm. Run your scripted load tests, compare with previous results, and automatically update your ScaledObject manifest.
Reactive optimization
Monitoring the right platform and application metrics will surface optimization opportunities (and anticipate problems). Following are some of the metrics you want to keep an eye on:
Application response time: if the response time generally goes up, it might be time to re-evaluate your baseline performance and adjust your target RPS accordingly
Number of active pods: changes in active pods patterns usually indicate a sub-optimized autoscaling configuration. Spikes in number of pods can be an indication of a too low target
Pod CPU & memory utilization %: monitor your pods utilization to adjust your rightsizing settings
Request per seconds per pod: if the RPS of single pods is much below the configured target, the target is too low which results in underutilized pods
This process can also be automated to a certain extent. Some alerting mechanism which provides recommendation is best, in most cases you want a human looking at the metrics and decide on the appropriate action.
Conclusion
I’ll repeat what I’ve said at the very beginning of this article: autoscaling is not the solution to poor application performance problems. That being said if your application is optimized and you’re able to predictably scale horizontally, KEDA is the easiest way to get started with autoscaling. Just remember that KEDA is just a tool and in my experience, the number one impediment to a successful autoscaling implementation is a lack of understanding of testing procedures or lack of tests altogether. If you don’t want to end up with a huge bill at the end of the month, reach out to Perficient for help!
