
Introduction:
Data pre-processing is a data mining technique that involves transforming raw data into an understandable format. Real-world data is often incomplete, inconsistent, and/or lacking in certain behaviors or trends, and is likely to contain many errors. Data preprocessing is a proven method of resolving such issues. When we talk about data, we usually think of some large datasets with huge number of rows and columns. While that is a likely scenario, it is not always the case — data could be in so many different forms: Structured Tables, Images, Audio files, Videos etc.
Machine Learning algorithms don’t work so well with processing raw data. Before we can feed such data to an ML algorithm, we must pre-process it. In other words, we must apply some transformations on it. With data pre-processing, we convert raw data into a clean data set.
The steps used for Data Pre-processing are: –
- Import Libraries. First step is usually importing the libraries that will be needed in the program.
- Get the Dataset
- Data Exploration or Analysis
- Taking care of Missing Data in Dataset
- Encoding categorical data
- Splitting the Dataset into Training set and Test Set
- Feature Scaling
We have used a titanic data set for better understanding. This is a very famous dataset and it’s often a student’s first step in machine learning classification. We’re going to do basic pre-processing on the dataset.
Let’s go ahead and get started: –
1)Import Libraries
import pandas as pd
import numpy as np
import os
import matplotlib.pyplot as plt
import seaborn as sns
%matplotlib inline
- NumPy: -NumPy is a Python library used for working with arrays. It also has functions for working in domain of linear algebra, Fourier transform, and matrices.
- pandas: -Pandas is used to analyse data.
- seaborn: -Seaborn is a library that uses Matplotlib underneath to plot graphs. It will be used to visualize random distributions.
- matplotlib: -Matplotlib is a low-level graph plotting library in python that serves as a visualization utility.
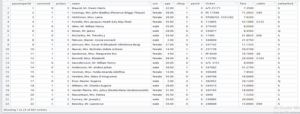
2)Get the Dataset
- train = pd.read_csv(“train.csv”)
The above statement is used to read dataset into pandas dataframe.
train is the name of the dataset and read_csv is an important pandas function to read csv files and do operations on it.
3)Data Exploration/Analysis
- train.info()
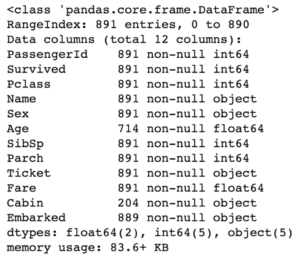
This gives the information about the dataset
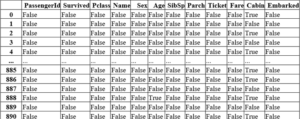
- train.isnull()
- train.describe()
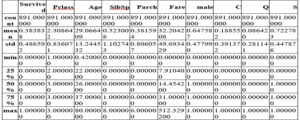
This describes count, min, max etc of each column of our dataset
4)Taking care of Missing Data in Dataset
- sns.heatmap(train.isnull(),yticklabels=False,cbar=False,cmap=’viridis’)

Fig: Heatmap for checking null values

Here, these yellow dashes show that we have some missing information. So, we can just glimpse on our data from a very far bird’s eye view and check out that yes, we’re missing some age information and a lot of Cabin information.
The proportion of age missing is likely smaller for a reasonable replacement of some form of imputation meaning we can use the knowledge of other columns to fill in reasonable values.
Looking at the cabin column however it looks like we’re just missing too much of that data to do something useful with it at a basic level. We’re going to probably drop this column.
There are many ways to treat missing values, but we are going to use two of them
1) Impute missing values with mean/median
2) Deleting rows with missing values.
We are going to use Imputation for Age column
- train[‘Age’].plot.hist(bins=55)

Fig: Histogram for checking age
Here, we are going to fill the mean age of the passengers
However, we can even be a step smarter about this and check the average age in passenger class.
- boxplot(x=’Pclass’,y=’Age’,data=train)
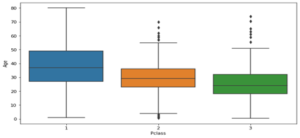
Fig: Boxplot
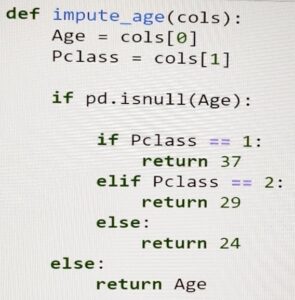
Below is the method we use to impute age column: –
- train[‘Age’]=train[[‘Age’,’Pclass’]].apply(impute_age,axis=1)
 And it looks like now we are no longer having any missing information for the age column.
We successfully put in values that were reasonable guesses for people’s age based on their class.
Now the issue we have is the cabin column and just honestly there’s too many missing points to do something useful of this column here. But there’s just so much missing information here that it’s just easier to go ahead and drop that cabin column.
- drop(‘Cabin’,axis=1,inplace=True)
5) Encoding categorical data
Machine learning algorithm cannot work on categorical value so we will convert them into dummy values. If you see the sex column here, we have a categorical feature of male or female. A machine learning algorithm isn’t going to be able to take in just a string of male or female will have to create a new column in The King a zero or one value for if someone is male or not in order to encode that information in a way that a machine learning algorithm can understand it. Same applies for embark column.
- sex=pd.get_dummies(train[‘Sex’],drop_first=True)
- embark=pd.get_dummies(train[‘Embarked’])
- train=pd.concat([train,sex,embark],axis=1)
- drop([‘Sex’,’Embarked’,’Name’,’Ticket’],axis=1,inplace=True)
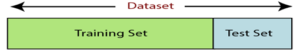
6) Splitting the Dataset
Every dataset for Machine Learning model must be split into two separate sets – training set and test set.
- from sklearn.model_selection import train_test_split
- X_train,X_test,y_train,y_test=train_test_split(X,y,test_size=0.3,random_state=101)
- x_train – features for the training data
- x_test – features for the test data
- y_train – dependent variables for training data
- y_test – independent variable for testing data
Therefore, the train_test_split() function includes four parameters, the first two of which are for arrays of data. The test_size function specifies the size of the test set. The test_size maybe .5, .3, or .2 – this specifies the dividing ratio between the training and test sets. The last parameter, “random_state” sets seed for a random generator so that the output is always the same.
7)Feature scaling
Feature scaling marks the end of the data pre-processing in Machine Learning. It is a method to standardize the independent variables of a dataset within a specific range. As a result, feature scaling limits the range of variables so that you can compare them on common grounds.
We can perform feature scaling in two ways: –
1: Standardization
2: Normalization
Conclusion:
So, that’s data processing in Machine Learning in a nutshell! Firstly, we discussed Machine Learning with Python data pre-processing. Secondly, we discussed the Data Analysis and Data Visualization for Python Machine Learning. However, please note that every step mentioned here has several more subtopics that deserve their own articles. The steps and techniques we’ve explored are the most used and popular working methods. Once we’re done with data preprocessing, data can be split into training, testing and validation sets for model fitting and model prediction phases. Thanks for reading!
Your opinion matters
Please write your valuable feedback…
Links
https://www.javatpoint.com/data-preprocessing-machine-learning
https://www.upgrad.com/blog/data-preprocessing-in-machine-learning
What are the advantages and disadvantages of imputing missing values using the mean/median compared to deleting rows with missing values in data pre-processing?