New Features
The new features that we have judged to have the greatest potential impact to our customers are covered below. As with any new version, there are too many new features to cover here. If you see something that interests you and would like to explore how it might help you please contact us for a deeper dive. Click here for a look back at our blog Why You Need to Upgrade to Cognos Analytics 11.1.3 Click Here for the Full Listing of What’s New.
Role Customization
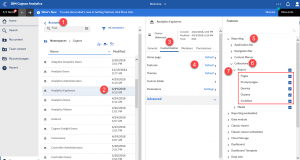
Many customers using Cognos versions 10.x who had great success using Query Studio for business user self-service have struggled moving to Cognos Analytics versions 11.X due to the presence of many components in the C11 reporting user interface designed for trained report developers who support the managed reporting requirements of those Enterprises, including Pages, Prompts, Underlying Queries, Classes, and Variables.
Now it is possible to administratively create custom roles that selectively hide those options. The result is a slimmed down reporting environment that very closely approximates Query Studio and offers a simplified self-service user experience that resolves most of the issues that may have prevented many customers from succeeding with Cognos Analytics for self-service.
Forecasting
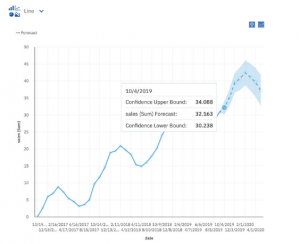
Forecasting in IBM Cognos Analytics is an automated set of tools for modeling time dependent data. It leverages a popular class of exponential smoothing models to discover and model trend, seasonality and time dependence in the observed data. This makes it applicable to a broad range of time series encountered in business and industry. Automated model selection and tuning makes forecasting easy to use, even for users not familiar with time series modeling. Forecasts and corresponding confidence bounds are very easy to understand when displayed in a visualization as a continuation of historic data. Forecasting is available in Dashboarding and Reporting.
Custom Visualizations
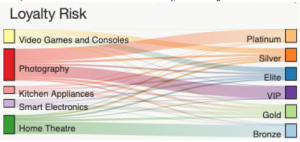
A particular focus of release 11.1.4 is the addition of an all-new API that facilitates the integration of D3 custom visualizations. D3.js (also known as D3, short for Data-Driven Documents) is a JavaScript library for producing dynamic, interactive data visualizations in web browsers.
Leveraging this capability requires JavaScript programming expertise. Contact us if you want to discuss further how you might leverage this in your environment.
Redesigned Home Screen with Customized Alerts
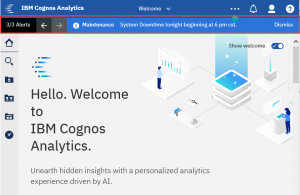
System administrators can create customized messages in the new alerts banner. Users can then stay informed of company-specific details, in addition to maintenance announcement and information on new and changed features.


