Consider the following scenarios:
- You’ve just launched your brand new Adobe Target optimization campaign but you aren’t sure if you are seeing any campaign content.
- Your boss has informed you that step 3 or 4 in the Adobe Analytics daily sales funnel report has gone missed as of yesterday.
- The Sales team has just informed you “High Value Prospects” (based on the Audience Manager segment) aren’t being presented with Summer BOGO promotional offer on the homepage.
Not the best news one could hear right after the morning coffee – but not uncommon and certainly not an impossible challenge to overcome. While there are obviously a number possible causes for the scenarios above, the goal is to identify the roots cause(s) as efficiently as possible. Although you could log into each of the systems to validate campaign settings, launch information, etc. – wouldn’t it better if there was a single tool you could use to view exactly what the Experience Cloud libraries are doing on a given page? Well that tool exists – it’s called the Adobe Experience Cloud Debugger!
What is the Adobe Experience Cloud Debugger?
The Adobe Experience Cloud Debugger (previously the DigitalPulse Debugger) is a free tool provided by Adobe that lets you view the data being collected on your site by most of Adobe’s Experience Cloud products. This means that **almost any data the Experience Cloud SaaS tools collect or set on a site visitor’s machine via the browser can be viewed in a normalized, easy to read dashboard. No more invoking your browser’s developer tools/Firebug panels searching for arcane request/response pairs for each cloud product – with the click of a single button all of the information needed to start the debug process is at your fingertips. A significant timesaver!!!
The Adobe Experience Cloud Debugger currently supports the following SaaS tools:
- Adobe Advertising Cloud (formerly Media Optimizer)
- Adobe Analytics
- Adobe Audience Manager
- Adobe Target
- Experience Cloud ID Service (formerly VisitorID service)
- Dynamic Tag Management (DTM)
- Launch, by Adobe.

Getting Started with the Experience Cloud Debugger
To use the Experience Cloud Debugger, you’ll first need to install the extension from the Chrome Web Store. In addition, you can read about use cases, version history and more by visiting the dedicated page on Adobe’s site – https://marketing.adobe.com/resources/help/en_US/experience-cloud-debugger/. Once installed, navigate to a page running any of the supported Experience Cloud products and execute the extension from the Chrome menu.
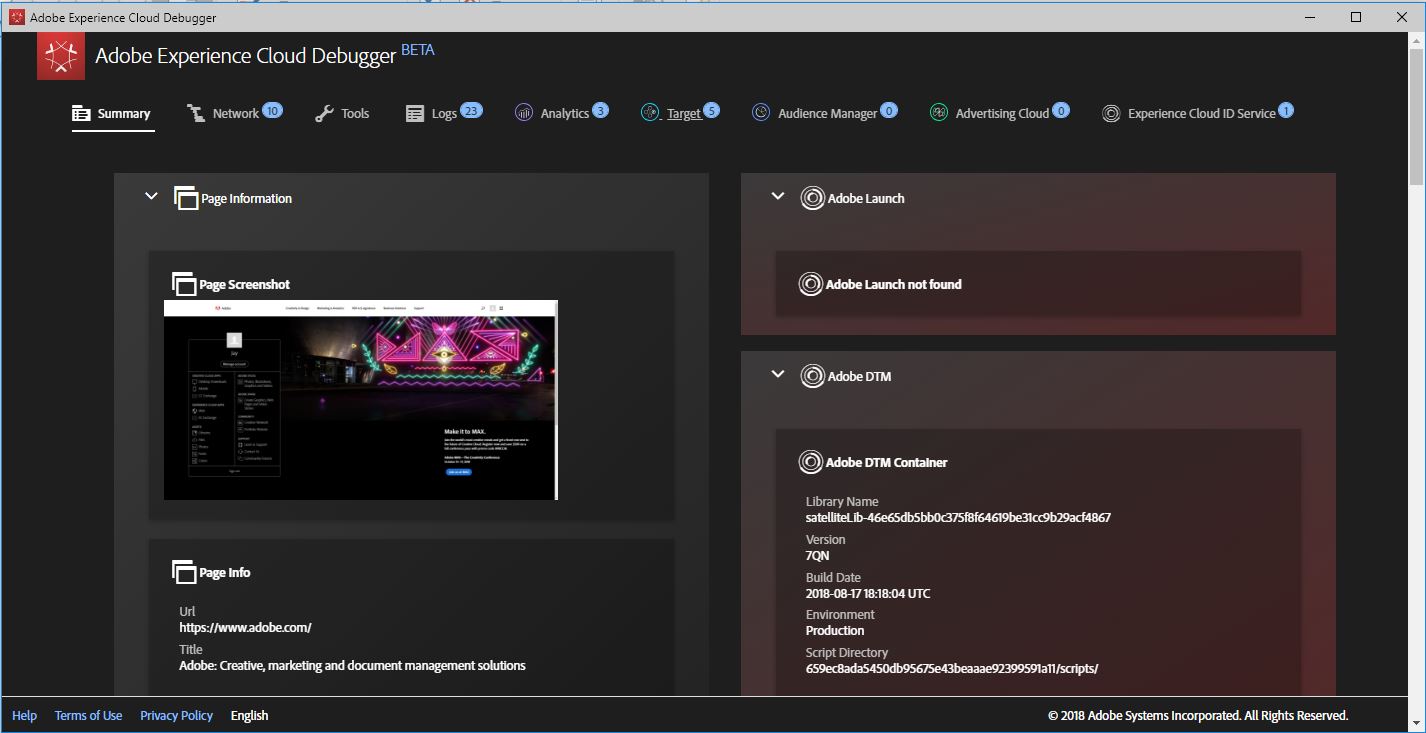
As you can see, the window lists dedicated tabs for each of the supported Experience Cloud tools in the top row and defaults to the Summary tab which contains the most important information captured for each service. In the above example, you can easily see there are 3 Analytics calls, 5 Target mbox calls and one Cloud ID service call.
So far, so good – 3 of the four services in our original scenarios are at least running on the page; we can turn our attention towards campaign troubleshooting and away from implementation troubleshooting for these three. But what about that “0” Audience Manager server-call item – could there be an issue there? There could be a problem if the Client-Side DIL is being used or completely normal if Analytics Server-Side Forwarding is enabled. Based on the implementation, you would either proceed to validating the Audience Manager implementation or looking at the Target campaign or AAM segment qualification(s).
The good news for those Target administrators who were used to the legacy DigitalPulse Debugger is a good bit of the old functionality has been ported over including the ability to Disable Target, Highlight all available mboxes (except the auto created Global mbox), enable console logging and the familiar mboxTrace. In addition, the Experience Cloud Debugger includes a few new features not available in the legacy debugger including:
- View network requests generated by each of the services.
- DTM\Launch specific tools such as disabling, inserting the libraries into a page even they don’t already exist, etc.
- Logs of every action seen by the debugger and the code that initiated the log entry
- Run an Audit of up to 100 pages of the site
- Much more…
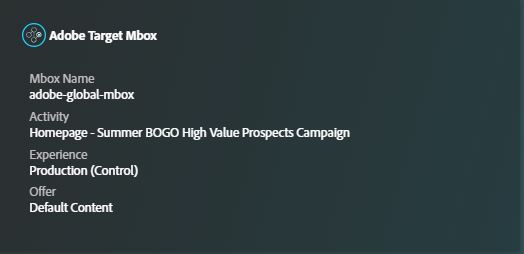
Lastly, back to our Summer BOGO scenario above; using the debugger we can see that I was able to qualify for the campaign but I am part of the Control group and therefore was presented with default content, e.g., the normal website. Crisis likely averted!!
A Few Drawbacks
One of the beauties of the legacy PulseDebugger was that it was completely JavaScript based and therefore browser agnostic. That meant that there were no extensions/addins to install or update – simply add a bookmark in your favorite browser (yes, even IE9) and it just worked. The new Experience Cloud Debugger is a formal Chrome extension which needs to be installed from the Chrome Web Store in order to use. While it’s true Chrome holds a commanding lead in terms of browser market share (certainly amongst developers), that’s still a sizeable user based stuck using old technology (DigitalPulse) or time-consuming methods (browser tools). It’s also not uncommon for a problem to only occur in certain browsers – usually some version of Internet Explorer. Hopefully the Chrome extension can be ported to Firefox, Safari and Edge in the future.
In addition, compared to the old DigitalPulse debugger the new Experience Cloud version takes up a ton of screen real-estate. Not necessarily a big deal if you have a dual monitor setup but not a very good experience if you are on your laptop.
Finally, as of this writing the debugger is still technically in Beta so there is potential for data/usage issues. That said, it has already gone through 5 public releases and looks pretty solid as is.
In Conclusion
So long as you are using Chrome and have a large enough monitor to view the dialog box, the Adobe Experience Cloud Debugger is a worthy upgrade to the legacy PulseDebugger. The easy to use summary panel, new Tools section and support for DTM/Launch functionality makes it a not only a worthy addition to your testing/debugging toolset but also a useful tool to provide to Business stakeholders for their own UAT activities.
Enjoy!
** For security reasons, Adobe Target userProfile data is not displayed within the debugger; you must generate a token and leverage your browser’s developer tools to view this data. mboxProfile data is displayed.