If you ever had a requirement or thought of creating an analysis report in BICS to display report columns dynamically, but later had to give it up due to the complexity, you might find this blog post is what you’ve been waiting for.
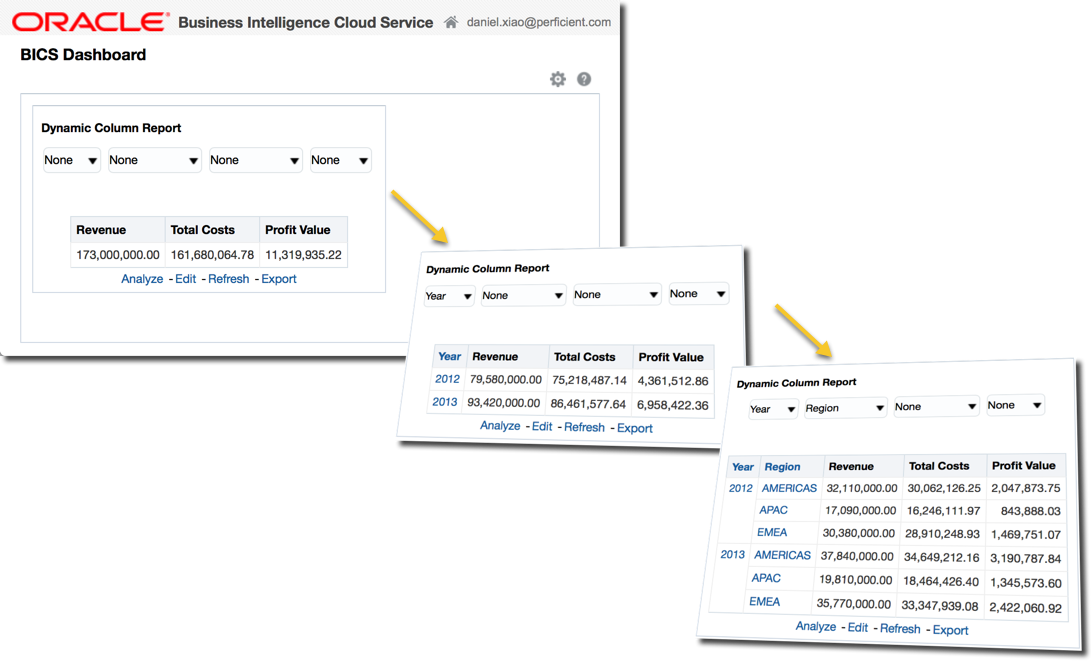
I am going to show you how easily such a report can be created in three very simple steps. The report uses Column Selectors to achieve the goal. Here is how the target analysis report looks like after it’s done building. The example is built using the default SampleApp in BICS.

1. Create a dummy database view in BICS schema service
Launch Apex to access the BICS schema service. Go to SQL Workshop, then SQL Commands to run the following SQL command to create a view named V_NONE_COLUMN_PROMPT. The view contains only one column called NONE_KEY with numeric data type.
CREATE OR REPLACE FORCE VIEW "V_NONE_COLUMN_PROMPT" ("NONE_KEY") AS
 select 0 as None_Key from dual
2. Create a dummy dimension in SampleApp
Launch analysis to access BICS data modeler and open the SampleApp data model. Click Lock to Edit to allow editing to the SampleApp data model.
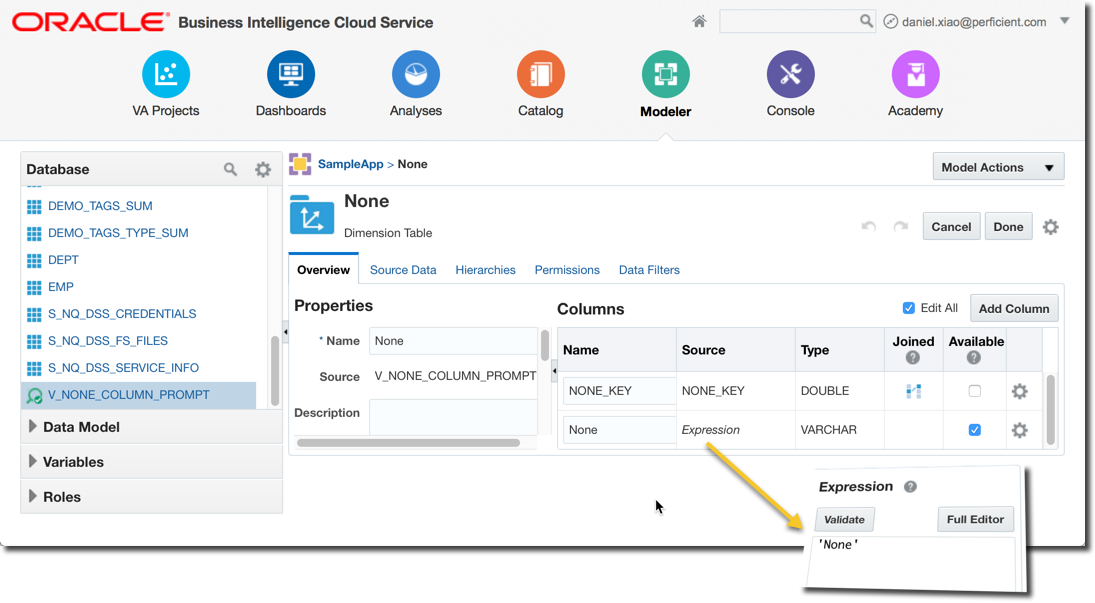
Locate the dummy view V_NONE_COLUMN_PROMPT under the Database on the left and add it to the model as a dimension.
- Rename the dimension’s name to None
- Uncheck the Available checkbox for the NONE_KEY column
- Add a new column, name it to None, edit and set its expression value to ‘None’ (with the single quotes)

- Create a dummy join between the dummy None dimension and any of the existing fact tables. The example uses the Advanced Calcs fact table. It doesn’t matter which fact table to join to, as long as there exists one fact join for the None dimension to pass the model validation.

Now click the Publish Model to complete the SampleApp data model changes.
3. Create an analysis report with Column Selectors
Click Analysis icon on the top and Create Analysis on the upper right to create a new analysis report.
- Add the “None“.”None“ column to the report
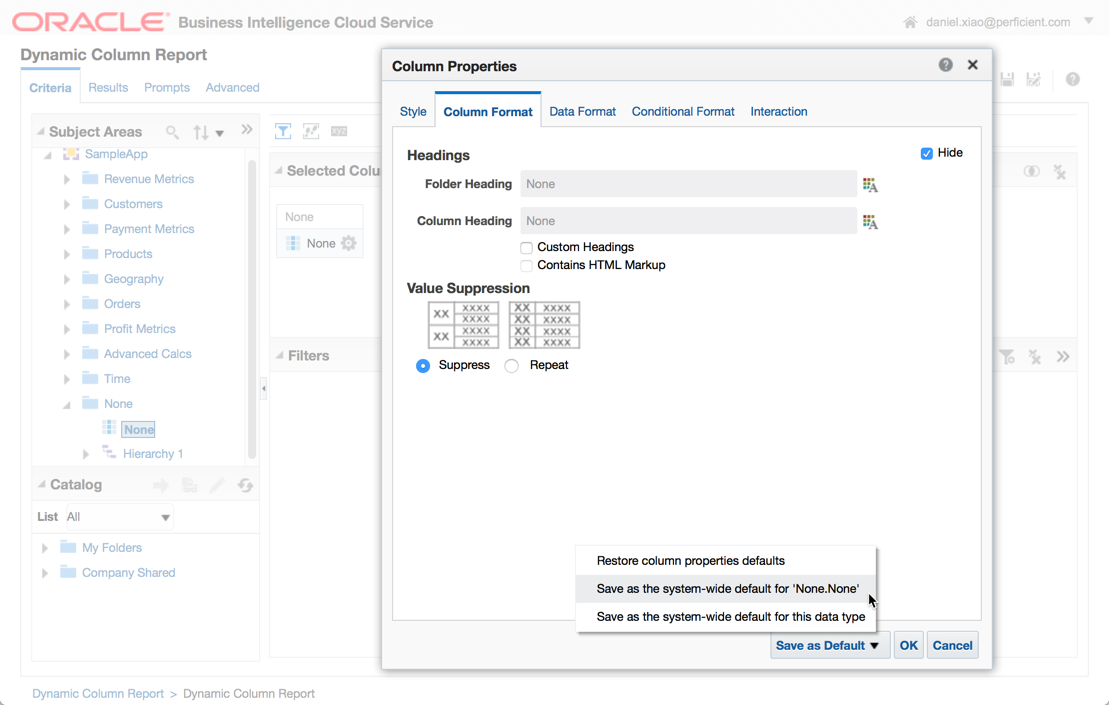
- Edit the column properties
- Make the column hidden (check the Hide checkbox in Column Format tab)
- Save the column properties as system default for the”None“.”None“

- Add 3 more”None“.”None“ columns to the report
- Add 3 metrics, Revenue column from “Revenue Metrics“, “Total Costs” and “Profit Value” from “Profit Metrics“
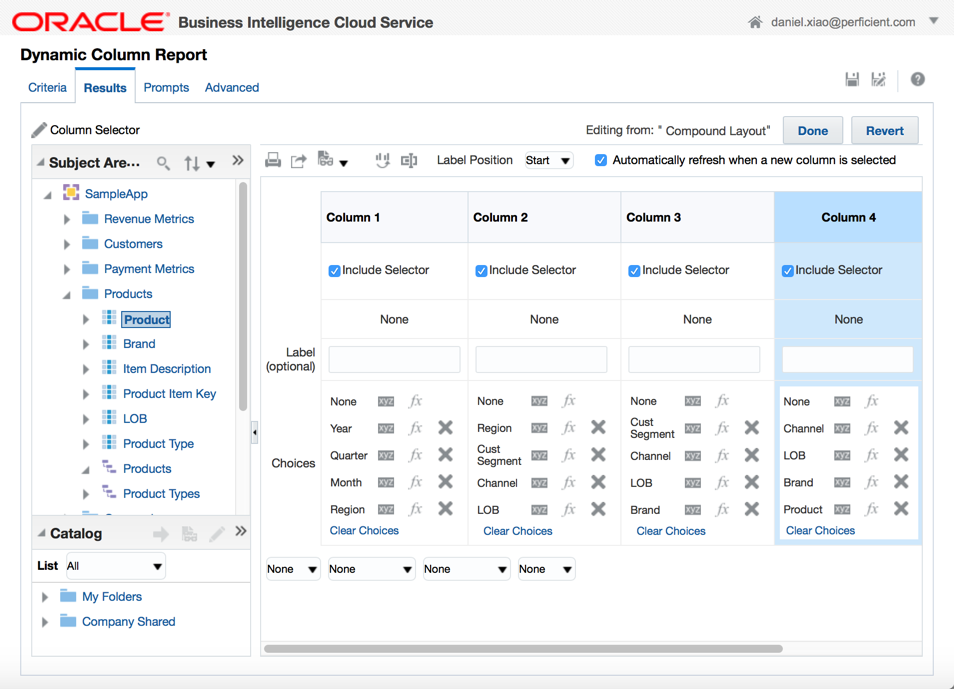
Go to the Results tab, and add a new Column Selector view. Check the Include Selector and add some additional report columns to each of the None column selectors. See the example below.

Finish editing the Column Selector view and then go back to the Results tab to add the Column Selector view to the Compound Layout view in between the Title view and the Table view.

Save the report. Now, if you follow the instructions and build everything correctly, you already have an analysis report that can display report columns dynamically based on the column selections.

To conclude, the example uses four None columns with dimension attributes, but the None column can also be used with fact metrics; therefore, it’s possible to make the entire analysis to display report columns dynamically. Theoretically speaking, there is no limitation on how many None columns can be used in a given analysis report. The same approach should work with the OBIEE on-premises, too.
Next >> Best Practices for Modeling Conformed Logical Dimension
