
“A pixel is worth 1024 bits”
In recent years, Organizations are pivoting towards the hottest keyword “BigData” to handle a wide variety of enterprise and social media data. Massive volume, complex and unstructured datasets are beginning to reshape many of the industries and hence the big data initiatives and implementations are priorities for many.
Macy’s is one of the best example for having used big data technology and have seen major improvement in revenue and user’s experience. With the speed of analysis and the reports generated out of this new technology, they have got a better idea of its most satisfied customers of what they like and what they don’t.
Compared to five years ago, now the data usage has become more and there is a need for more visualization. Here comes, the question why organizations need to embrace the data visualization? It’s human tendency to believe only when we see it. To answer this, data visualization is not a new trend, even in older days, they used paintings and maps for communication. We have already invented the graphs and charts based out of statistics like, bar chart, pie chart.
So, whats new in this latest trend that everyone talks about….Data Visualization here talks about the depiction of real-time data in the form of high-end charts and graphs. We have been previously doing this by loading data into database and data warehouse through ETL tools and nowadays, just using API’s we can visualize the real-time data. As this does not require any manual effort, organizations pivot towards this concept.
Open Source tools
There are many open source tools available in market for extracting data and to visualize the same. In this blog, we will explore about the ELK Stack, and how to visualize the network log data through those tools and also an alternate version of using Python.
ELK Stack
ELK Stack is the combination of ElasticSearch, Logstash and Kibana. Logstash is to connect to the source and to get the real time streaming log data, this will be connected to Elastic Search to set up an index for search. Finally, Kibana is integrated with these tools for dashboards creation and to create visualization effects based on the log data.
Let us see how we implement this with our sample network log.
Source: Network log file –
Configuration Steps
Once you downloaded all these tools, go to the respective folders and follow the below steps manually.
Common Step
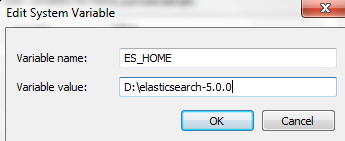
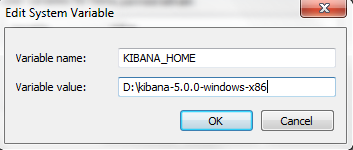
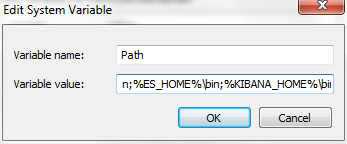
Add the home folder path in the environmental variable called Path in Advanced settings under System and Security/System in Control Panel as below:
You can also set the path using variables as mentioned in the batch file:
@ECHO OFF
SET ES_HOME=”D:\elasticsearch-5.0.0”
SET KIBANA_HOME=”D:\kibana-5.0.0-windows-x86”
setx PATH “;%ES_HOME%\bin;%KIBANA_HOME%\bin;” /m
PAUSE
Logstash Configuration:
Step 1: Go to the <installed path>/config folder, and edit the logstash.yml file as below
- host: “localhost”
- port: 9612 (Can be anything between 9600 to 9700)
Step 2: Create a config file, logstash_inout.Conf, and write the below script in the file

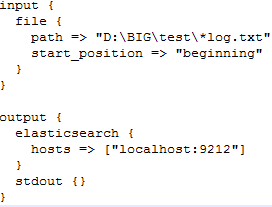
- This indicates logstash reads the input data from log file and send it to elastic search that is configured in the localhost with the port 9212.
Step 3: Go to bin folder in the command prompt, and run the following command.
Logstash -f logstash_inout.conf
Troubleshooting:
- In case of Java version or JVM issue, install the proper version of JRE and JDK and run it
- If you face heap size issue, go to jvm.options file under config folder and change the heap size setting as -Xms1g; -Xmx1g
Step 3: Go to the Internet Explorer and specify the URL as localhost:9212 (your port number)
ElasticSearch Configuration:
Step 1: Go to the <installed path>/config folder, and edit the elasticsearch.yml file as below
- Mention descriptive name for cluster as
- name:Netlog
- host: “localhost”
- port: 9212 (Can be anything between 9200 to 9300)
- zen.ping.unicast.hosts: [“127.0.0.1”, “[::1]”]
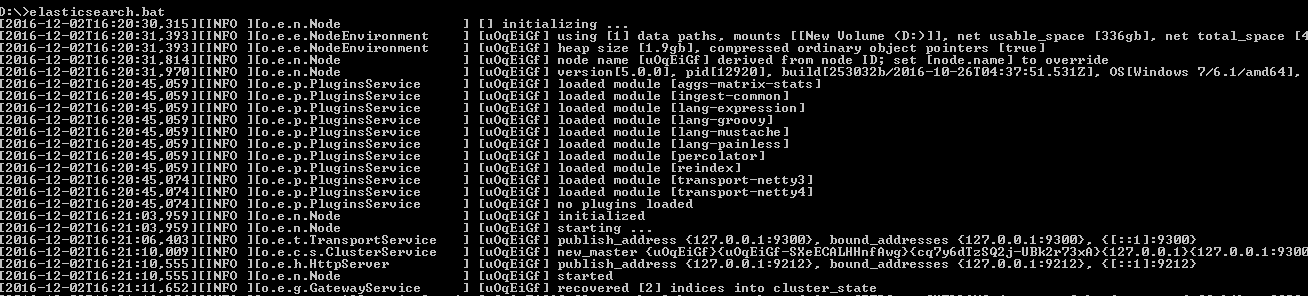
Step 2: Go to bin folder in command prompt and execute the elasticsearch.bat script
- The script should be executed successfully.

Troubleshooting:
- In case of Java version or JVM issue, install the proper version of JRE and JDK and run it
- If you face heap size issue, go to jvm.options file under config folder and change the heap size setting as -Xms1g; -Xmx1g
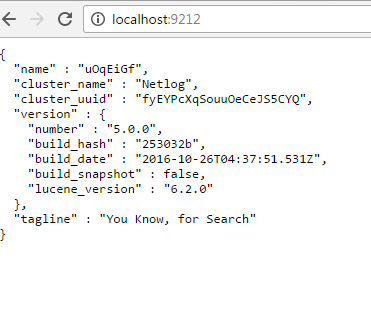
Step 3: Go to the Internet Explorer and specify the URL as localhost:9212 (your port number)

Kibana Configuration:
Step 1: Go to the <installed path>/config folder, and edit the Kibana.yml file as below
- Specify default port as 5601
- Port:5601
- url: “http://localhost:9212”
Step 2: Go to the bin folder in command prompt and execute the Kibana.bat script
- The script should be executed successfully.
![]()
Step 3: Go to the Internet Explorer and specify the URL as localhost:5601
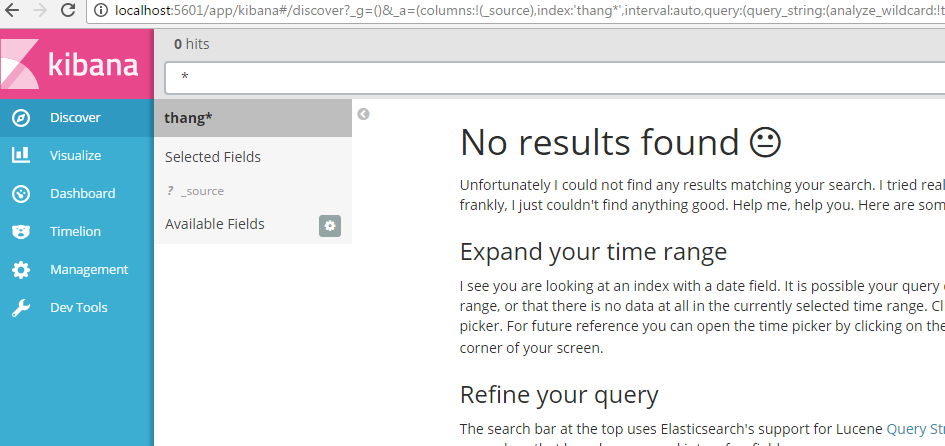
Step 4: Specify the index name in the search and press enter
Step 5: Go to visualize page and create the dashboards based on the filters that you create
Visualization in Kibana:
Based on the above explanation, let us see the results in Kibana screen for the given input file.
To filter out the data based on the browsers with the following data points:
Chrome – 131
Firefox – 240
MSIE- 25
Opera -15

To filter out the data based on the services with the following data points:
GET – 290 ; PUT – 93 ; DELETE- 42; POST -48
