Oracle has expanded its Data Visualization capabilities by releasing Data Visualization Desktop (DVD). The underlying “Visual Analyzer” technology has been part of the Oracle BI Cloud Service for over a year but is now available as a feature-rich desktop tool. As of right now, it is included with Data Visualization Cloud Service, Business Intelligence Cloud Service and is part of the Data Visualization add-on to OBIEE 12c. For more information about Data Visualization desktop please see the following: https://www.oracle.com/solutions/business-analytics/business-intelligence/data-visualization.html.
You can download an evaluation copy from OTN: http://www.oracle.com/technetwork/middleware/oracle-data-visualization/downloads/oracle-data-visualization-desktop-2938957.html
You may be wondering why you would want to use the desktop version opposed to the web version. At this point, the desktop program is more feature-rich and allows users to combine data from multiple data sources including cloud applications, on-premises databases, Big Data platforms and Excel files.
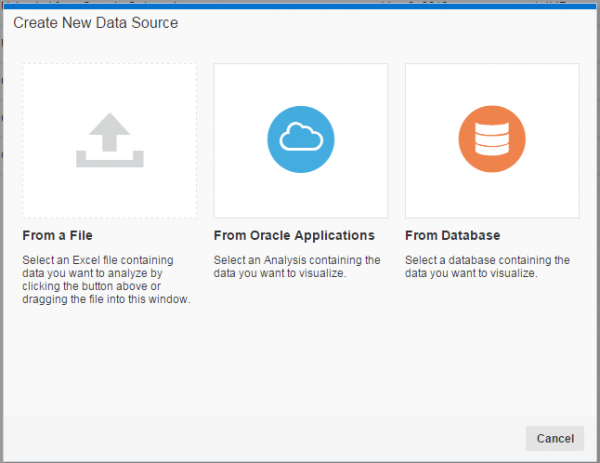
There are three Data Source Options when creating a new “project.”

- From a File: This allows users to import an Excel file into DVD.
- From Oracle Applications: This allows users to import the data from an OBIEE Analysis report. This works with the latest version of OBIEE 11g and 12c.
- From Database: This allows users to import data from a variety of external data sources, this includes common relational databases and cloud platforms such as Salesforce.com. You have the option of using a local cache or have a “Live” connection which queries the data source directly.

I’m going to connect to an Oracle Database and add two HR tables from a sample “HCM” system: Employee and Department. I select the schema of my HR data, called “HR” and then select the two tables.


Now when I create a new project, I have the added tables in my Data Source list. I will click on both tables and click “Add to Project.” You now need to determine if the data is an attribute or a measure. For instance, Manager ID and Department ID are numbers but they are attributes not measures. There is an option called Query mode, for database connections you can select between Live and Auto which does caching.


Now I need to ensure the the two tables are connected properly so I look at the Source Diagram and then click on the line between the two tables to make sure it is joined using Department ID.

I can now modify the data set with calculation columns in much of the same manner as you would in OBIEE. The updates made here will be available for future use in the data set. To do this first click on the Stage icon in the toolbar.

Now I can add calculated columns to the data set by clicking on the right of the column name, click Create “Column…” and then I’m creating a simple Tenure calculation.

Now the following data columns are available:

I can now create Data Visualizations such as the one below, I’m viewing this using the Presentation Mode option.

