I was “lucky” enough to be selected to “go on the road” this year as part of my organizations presence at the IBM business analytics summits, taking pace all over the country. If you haven’t attended one yet, you should as the content presented is both exciting and relevant
Particularly interesting to me – being a performance management guy – is the session entitled “Visualization – gaining value from your data”. In that session the presenter reinforced the importance of visualizations to understand data and offered the fact that today there is an estimated 2.5 exabytes of data being generated every day. Yes, exabytes! See below:
“The exabyte is a multiple of the unit byte for digital information. The prefix exa indicates multiplication by the sixth power of 1000 or 1018 in the International System of Units (SI). Therefore one exabyte is one quintillion bytes (short scale).” – Wikipedia 2014
Anyway, with that kind of big data, presenting using conventional means – like a spreadsheet – is all but impossible (you can’t even get all of the important data points on a single screen!). Even with a much smaller “set” of data, spreadsheets can’t fully unlock all of the value – think about patterns or trends – they are more difficult to see by just looking at rows and columns.
The IBM solution? – RAVE rapidly adaptive visualization engine.
If you sit in on this summit session (and I recommend it) you’ll hear how Rave is the engine behind Cognos Insight, and has the ability to create effective visualizations that:
- Visualize 600,000 transactions or more
- Effectively display deep and broad data
- Utilize a simple “descriptive language” to describe a chart or other visual
- Is flexible enough to describe all known charts and extensible to describe new and innovative visualization
- And more!
The RAVE engine approach is exciting.
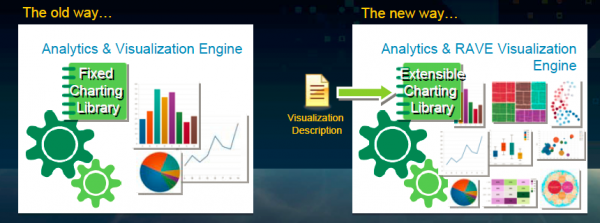
Traditionally, analytical visualization engines ran a fixed library of charts; today, with RAVE, the library is completely extendible and therefore has literally no limits. IBM and its partners are constantly creating new visualizations which can be available to you to download and consume. Oh yeah, and everything can run on your IPad!
I don’t want to give anymore away but you can see the full presentation and demo at the summit and if you attend, don’t forget to drop by the Perficient booth and say hello!


