Having recently completed the course “IBM SPSS Modeler & Data Mining” offered by Global Knowledge, I was looking to find more opportunities to do some modeling with SPSS Modeler. So, when I read in the news recently, about college recruiters using predictive techniques to determine the probability of a particular recruit graduating on time, I thought it would be interesting to explore that idea.
For Example
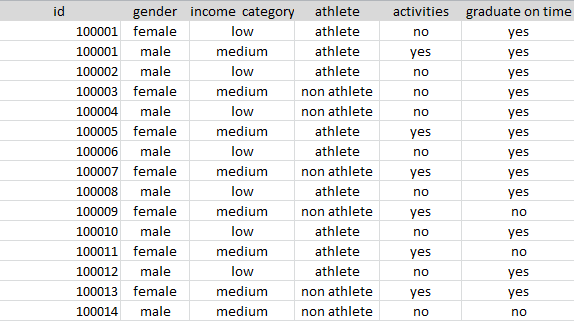
My college wants to determine if a recruit will graduate on time or not. The institution can draw a sample from its historic data and using this sample, possibly predict if a particular recruit would graduate on time. The sample below gives us an idea such a historical dataset. Typically, a dataset will include a field that indicates the behavior, here: has the student graduated on time? Yes or no.
An Idea – and some cross tabulation!
The college recruiters have a hunch that there is a difference between students who are athletes and students who are not and if a student participates in collegiate activities or not. Based on this hunch, they investigate to see if there might be any differences in graduating on time statistics – by cross tabulating on “athlete”:
![]()
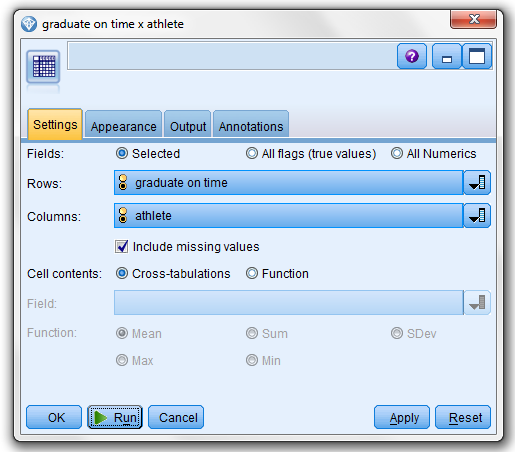
In IBM SPSS Modeler, it is very simple to cross tabulate data using the Matrix node. You can simply drop it into your stream, connect it to your source data and set some parameters. For example, I set “Rows” to the field in my file “graduate on time” and “Columns” to “athlete”. (I also went to the “Appearance” tab and clicked-on “Counts” and “Percentage of column” for my “Cross-tabulation cell contents”.
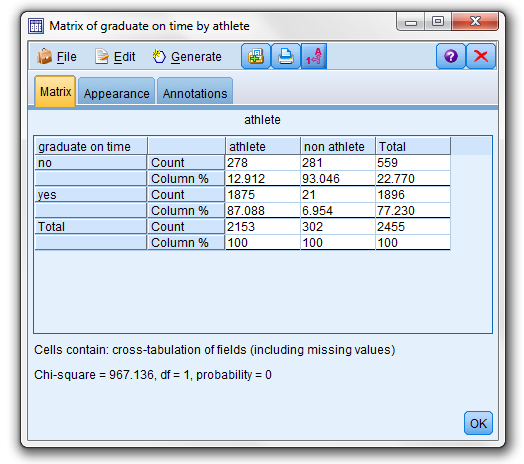
After clicking “Run”, the output is ready for review:


Another Analysis Tool
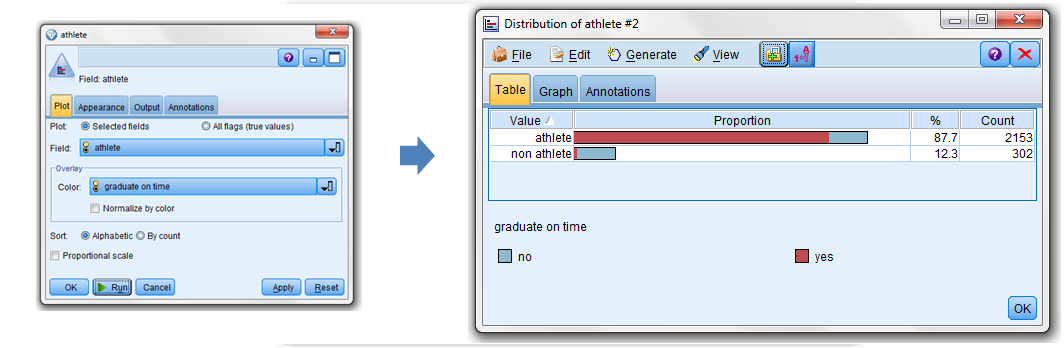
SPSS Modeler also provides the Distribution Node which lets you show the occurrence of symbolic (non-numeric) values, in this case, “graduated on time” or “athlete”, in our dataset. A typical use of the Distribution node can be to show imbalances in the data (that can be rectified by using a Balance node before creating a model). What I did was use the node to plot “athlete” overlaid with “graduate on time” for an interesting perspective:
Back to the Analysis
Looking at my cross-tabulation output, it appears that 93 % of the non-athlete students did not graduate on time, while for the students who were athletes; only 13 % did not graduate on time. The question now is -can this difference be attributed to chance (because just a sample was drawn) or, does the difference in the sample reflect a true difference in the population of all students?
The Chi-Square test is a statistical test is used to answer this question. This test gives the probability that the difference between athletes and non-athletes can be attributed to chance.
![]()
The CHAID Node
CHAID, or Chi-squared Automatic Interaction Detection, is a classification method for building decision trees by using chi-square statistics to identify optimal splits. Again, SPSS Modeler offers the ‘CHAID Node” that can be dropped into a stream and configured. In my exercise, I set my (CHAID) target to “graduate on time” and my predictors to “activities” and “athlete”. My results are presented in the viewer which shows a “tree” to present the data. The initial node shows the breakdown of graduate on-time vs. not on-time and then modeler broke out the next level as students who did not participate in activities and those who did.

The exercise found the probability (P-Value) to be 0, so the probability is 0 that the difference between students involved in activities vs. those who are not can be attributed to chance. In other words: there are differences between participating in activities and graduating on-time!
Looking at these results, I concluded that students who do not participate in activities during their college career have a much higher chance of NOT graduating on time (96 %) – vs. those that do participate in activities (3 %).
The next step might be to zoom in on these students that do not participate in groups. Modeler broke down the “tree” into a third level:

Here, modeler tells me that those students that do not participate in activities are both athletes and non-athletes. The non-athletes who do not participate in activities have a slightly better “on time” rate then do the athletes who do not participate in activities.
Conclusion
Of course there is more to a legitimate data mining project, but it clear that IBM SPSS is a handy tool that “fits” for novice to expert level data scientists. More exploration to come!