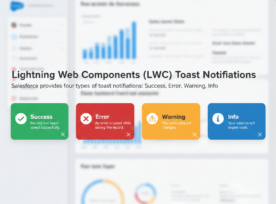
Hello Trailblazers! Take a scenario where you are creating a record in Salesforce, and you are not getting any kind of confirmation via notification whether your record is created successfully or it throws any Alert or Warning. So, for this, Salesforce has functionality called “Toast Notifications”. Toast notifications are an effective way to provide users […]
Posts Tagged ‘#PerficientMakesAdifference’
One Team, One Breath: Celebrating International Yoga Day at Perficient Nagpur & Pune
The Yogic Way What happens when ancient mindfulness practices meet a modern workplace? You get International Yoga Day at Perficient – a thoughtful pause in the middle of our fast-paced workday, filled with movement, calm, and connection. Yoga, not just a term, not even a physical practice: it’s a celebration of harmony between the mind, […]
My Experience at the Salesforce Nagpur Ohana Gathering – June 2025
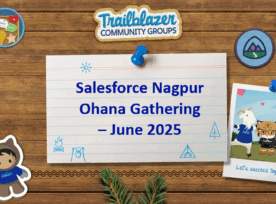
Hello Trailblazers! Last week, I had the amazing opportunity to attend the “Salesforce Nagpur Ohana Gathering June 2025.” This Meetup was packed with knowledge-sharing, networking, and inspiration. The event brought together passionate Salesforce professionals and featured insightful sessions from four expert speakers. Each session focused on a crucial aspect of the Salesforce ecosystem—from SOQL optimization to […]
How to Subscribe to Salesforce Reports
Hello Trailblazers! Salesforce Reports are a cornerstone of effective data-driven decision-making. They allow you to analyze and visualize business data efficiently. Salesforce offers a subscription feature for reports to ensure you or your team stay updated on important metrics without manually checking them. Subscribing ensures that you receive reports regularly in your email inbox, making […]
How to Subscribe to Salesforce Dashboards?
Hello Trailblazers! Salesforce Dashboards are powerful tools that allow users to visualize and analyze data at a glance. To stay updated on key metrics without manually checking dashboards, Salesforce provides a subscription feature. Subscribing to dashboards ensures that you and your team receive timely updates via email, helping you stay informed and make data-driven decisions. […]
How to Create a Bucket Column for the Picklist Type Field in Salesforce Report
Hello Trailblazers! Salesforce provides powerful reporting tools to analyze and visualize data effectively. Among these tools, the Bucket Field stands out as a feature that enables categorization of data directly within reports. In this blog post, we’ll focus on creating a Bucket Column specifically for Picklist type fields in Salesforce Reports, offering a step-by-step guide […]
Key Insights from the Front-End Meetup by the Front-End Meetup Group
Let me take you through the event that perfectly wrapped up 2024! Perficient’s Front-End Team concluded the year with a memorable meetup filled with inspiring sessions and networking, setting the stage for an exciting 2025. We’re already excited about the next one! Event Overview The Front-End Meetup, hosted by the Front-end Meetup Group and sponsored […]
Bucket Field in Salesforce: Simplify Your Data Categorization
Hello Trailblazers! Salesforce Reports are a powerful way to analyze data, and one of their most useful features is the Bucket Field. This tool allows you to group report data into categories without creating custom fields or formula fields in your Salesforce objects. Whether you’re working with large datasets or need a quick way to […]
Schema Builder in Salesforce: A Comprehensive Guide
Hello Trailblazers! Salesforce Schema Builder is a robust tool that provides a visual representation of your data model. It allows administrators and developers to view, design, and modify objects, fields, and relationships in Salesforce effortlessly. Whether you’re a seasoned Salesforce expert or a beginner, Schema Builder can simplify your work and enhance your understanding of […]
How to Create Joined Reports in Salesforce: A Comprehensive Guide
Hello Trailblazers! Salesforce offers a range of reporting formats to help businesses understand and analyze their data. Among these, Joined Reports stand out as one of the most powerful reporting tools. They allow users to combine and compare data across multiple report types and objects within a single report. In this blog, we’ll explore what […]
A Comprehensive Guide to Creating Matrix Reports in Salesforce
Hello Trailblazers! Salesforce provides users with versatile reporting tools to manage and visualize data effectively, and Matrix Reports stand out as one of the most powerful report formats in Salesforce. Matrix reports allow users to group records by both rows and columns, making them highly valuable for detailed data analysis across multiple dimensions. This type […]
A Complete Guide to Creating Summary Reports in Salesforce
Hello Trailblazers! Salesforce provides users with a robust reporting toolset that enables businesses to analyze their data, identify trends, and drive smarter decision-making. Among the various types of reports available in Salesforce, Summary Reports stand out as one of the most popular due to their ability to group and summarize data effectively. Summary reports allow […]


