Over the months we have released a lot of information on building analytic platforms in healthcare. Several members of my team have played key architectural roles in not only implementing the Cogito platform and performing readmission analysis with it, but also expanding the platform to include customer satisfaction data from Press Ganey.
These functions were deemed critical to the initial phases of these projects, but are largely ‘back-end’ architectural projects. They do not address the ad-hoc analysis needs of the business, the delivery technologies available or much less the predictive capabilities that can be added to the platforms.
Fortunately there are a lot of new technologies in the Microsoft stack to address these needs.
As part of our advisory services to help our clients understand what new capabilities they have with their new platforms we regularly build concept visualizations. The following videos are examples of out of the box capabilities we built for one of our clients utilizing:
Self-service analytics with Power Pivot and Power View
3D visualizations with Power Map
And finally natural language query processing in the cloud with Q&A in Power BI
These technologies are well known and are being leveraged within several of our large clients, but a couple of recent announcements from Microsoft introduces even more exciting capabilities.
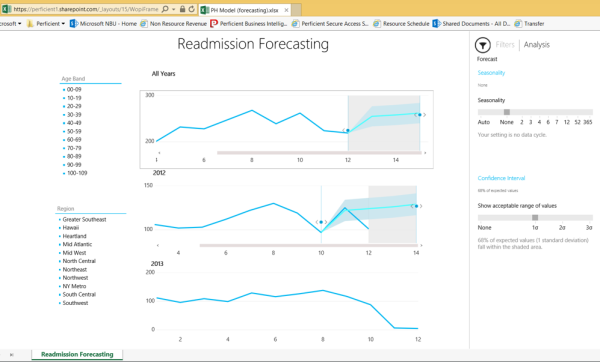
Power View now supports forecasting. This is a great new add currently available in the HTML5 version of Power View in Power BI. It gives the user the ability to quickly forecast a trend line, account for seasonality and even adjust the confidence intervals of the calculation. Below is a screenshot of some readmission forecasting being performed on the dataset from the earlier videos.

Important to note is that you not only see the forecasted line (light blue lines which runs through the top chart gray box) but the second chart also shows the hindcasting feature which lets a user start a forecast in the past in order to see how accurate it would have been against real data. (light blue line to the left of the gray box in the second chart).
While valuable and easy to use, this technology doesn’t give us the ability to predict who is at risk of readmitting. For that, we need a more powerful tool.
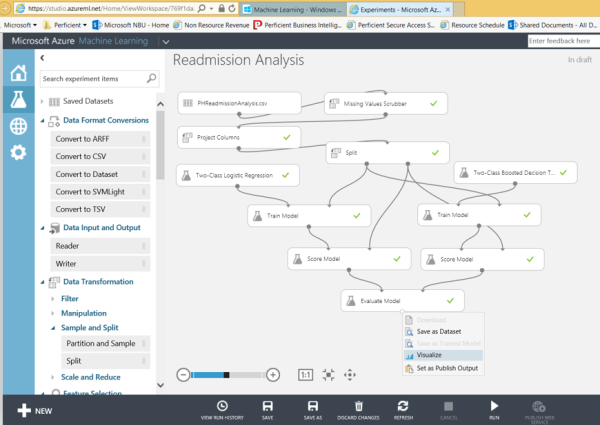
Azure Machine Learning Services is a recently announced cloud service for the budding Data Scientist. Through a drag and drop interface you can now build experiments of predictive models, train and score the models and even evaluate the accuracy of different algorithms within your model.
The screenshot below shows an experiment that was built against the same readmission data used in the forecasting example (Epic Cogito dataset). The dataset was modified to flatten multiple patient admissions onto one record and included the following attributes as well as some others:
![]()
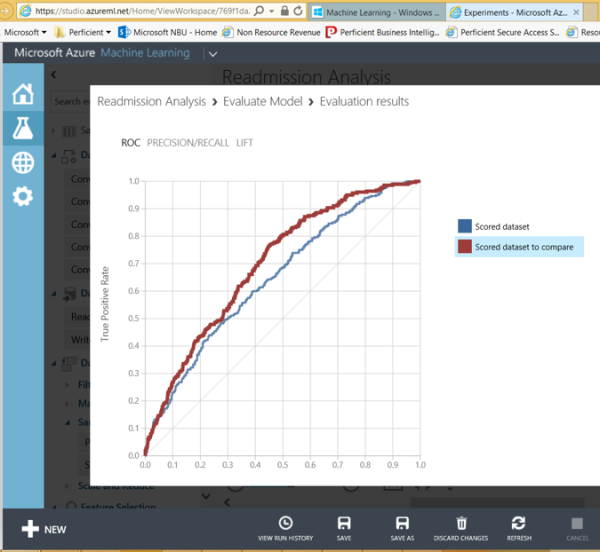
The experiment was then created to compare two different classification algorithms, a boosted decision tree vs. a logistic regression. *Note that this blog is not intended to debate the accuracy or appropriate use of these particular algorithms. These were just the two I used.

Once the experiment is complete and evaluated a simple visual inspection shows the accuracy gains one algorithm has over the other.

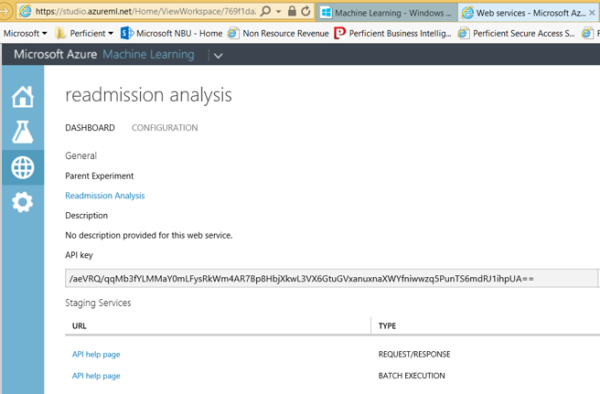
After some tweaking (and this model still needs it) there is a simple process to create a web service with the associated API key which you can use to integrate the model into a readmission prediction application. One that accepts single record or batch inputs.

As you can see, there are a number of options for introducing advanced analytics into your healthcare environment. Feel free to contact me with questions on how these tools can be put to work in your new healthcare analytics platform.
