We recently discussed reporting and the tracking of E2B transmissions in Oracle Argus Safety. Today, we’ll highlight some of the dashboards that are available in the drug safety and pharmacovigilance system.
As you can see from the menu in the first screenshot below, these are the dashboards built into the system.
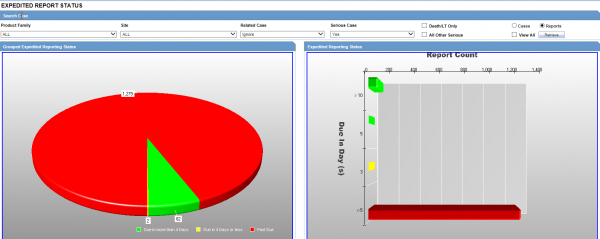
The screenshot below is an Expedited Report Status screen. Everything is color-coded and the screens are interactive.
For example, if you wanted to drill down into these cases to see exactly why they were late reports, you would just double-click on the red bar or pie section, and it would take you to a worklist where you could clearly see what happened with the individual cases.


