Risk committees have started asking a question many IT organizations are not yet equipped to answer: how do you know an AI agent is working? Not whether it demos well, but whether anyone can produce evidence, on request, that it behaves correctly across the situations it encounters. For many agent deployments, the honest answer is a demo; a handful of test prompts someone ran in a notebook, and a general sense that complaints have been manageable. That was acceptable when agents drafted content for a person to review. It isn’t acceptable when an agent retrieves regulated data, calls downstream systems, and acts on behalf of the organization.
In this post, I explain why evaluation and monitoring separate an agent pilot from an agent an enterprise can rely on, how most organizations handle this today, and how the Databricks approach differs. My focus is on evaluating agent behavior and output quality. Infrastructure concerns such as uptime, latency and token spend matter, but they are a separate discipline and not the subject of this post.
What Makes Agents Hard to Judge
Traditional software is tested against expected results. Agents do not work that way. Ask the same question twice and you may get two differently worded answers, both acceptable. Phrase it slightly differently and the agent may take an entirely different route to get there.
Output-only testing cannot catch what goes wrong in between. An agent can be right for the wrong reason, having pulled from a stale source or from a document the user was not entitled to see. It can be right after several redundant tool calls. These checks pass but are not production quality.
How Organizations Handle This Today
Three categories of tooling have formed around this problem.
Open-source evaluation frameworks: Teams run frameworks such as DeepEval and Arize Phoenix inside their test suites and CI pipelines, drawing on each library’s catalogue of scoring metrics. These are inexpensive, portable, and popular with engineering teams. They are also developer tools that produce developer artifacts.
Commercial evaluation and observability platforms: LangSmith, Braintrust, Arize AX and Galileo combine execution tracing with automated scoring and dashboards, including scoring of live traffic. They are capable and well designed. They are also a separate platform to procure, secure and govern, holding a copy of your prompts, your responses and often your retrieved content.
Cloud provider evaluation services: Microsoft Foundry observability, Amazon Bedrock AgentCore and Google’s Gen AI evaluation service, build evaluation into their respective stacks. These primarily suit organizations committed to a single cloud for AI workloads.
Where the Databricks Approach Differs: Evaluation Lives with Your Data
Databricks evaluates agents through Managed MLflow using scorers: code-based checks, and LLM judges where a language model grades the agent’s work. Built-in judges cover groundedness, relevance, safety, correctness against known answers, and whether tool calls were right and efficient. Quality rules can be written as plain sentences rather than code, so a compliance officer can author one and read the score with the reasoning attached. Domain experts label real traces in a web interface, and those judgments tune the judges toward your standards.
These capabilities are comparable to what is available by commercial evaluation platforms and cloud service providers, but the difference is in where the evaluation lives.
Evaluation artifacts are governed like data, because they are data. Traces, evaluation datasets, judges and expert feedback are Unity Catalog objects in Databricks sitting next to the tables the agent reads, under the same permissions, lineage and audit trail. When someone asks who was allowed to see the content an agent retrieved, there is always one answer.
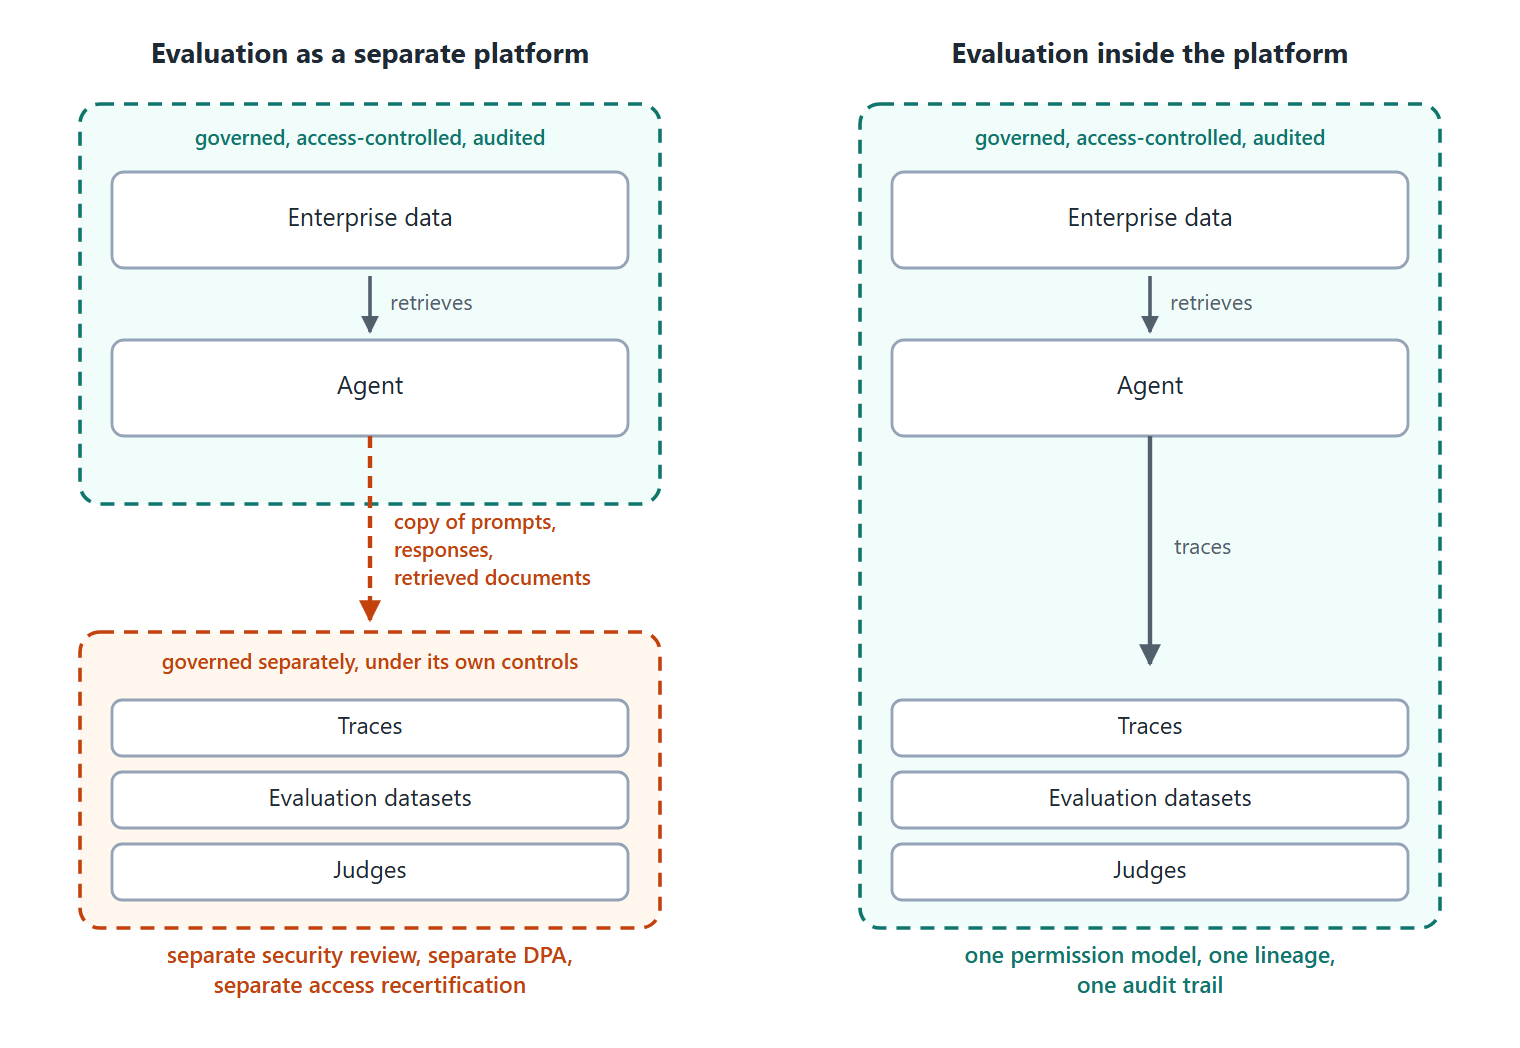
There is no new platform to clear. Every standalone evaluation platform holds a copy of your prompts, your responses, and often your retrieved documents. That copy needs its own security review, its own data processing agreement, and its own access recertification. For an organization already running on Databricks, evaluation is a capability of a platform that has been through all of that.
The engine is open. MLflow is Apache-2.0 licensed and runs outside Databricks. MLflow also executes DeepEval, RAGAS and Phoenix judges through the same interface as its own and lets you choose which model powers a judge. Adopting it means neither abandoning metrics a team already trusts nor accepting one vendor’s idea of a grader.
Judging the Route, Not Only the Answer
MLflow records each agent run step by step, down to the individual model calls, retrievals and tool invocations. Evaluation can therefore examine how the agent reached its answer, scoring whether the right tools were called with the right arguments and whether the sequence was efficient.
This is where the failures that output scoring misses become visible: the agent that quietly queried the wrong source, the one that looped on an ambiguous result, the one that reached a correct conclusion by a path nobody would have approved. It also improves the conversation with the business. Rather than debating whether an answer felt right, teams review what the agent did.
What This Means for the Operating Model
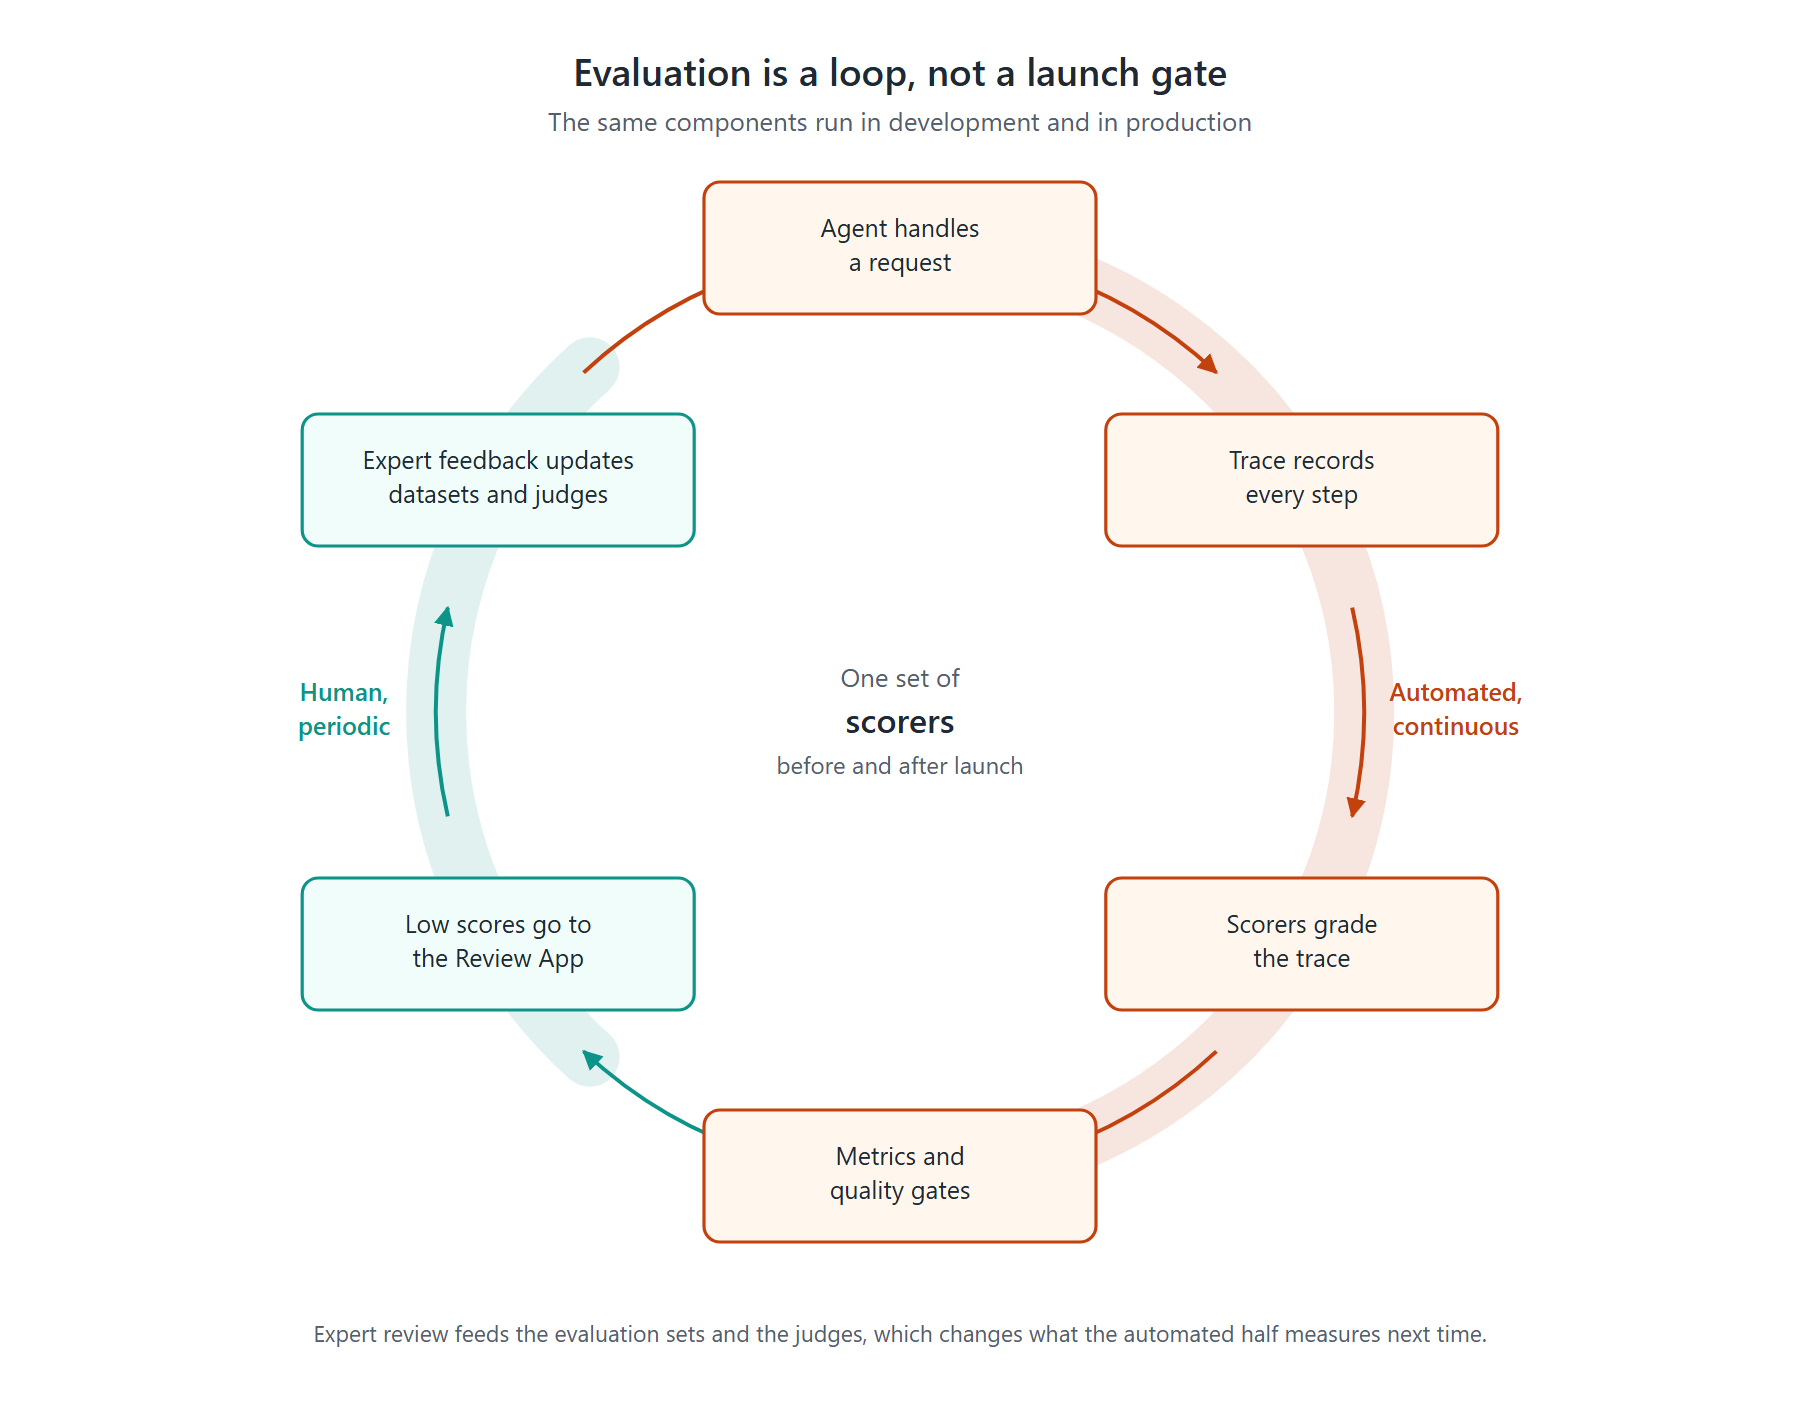
Agent evaluation is not a one-time activity. It’s an online feature. With Databricks Managed MLflow, production observability runs as background jobs. Live production metrics with custom LLM judge scoring for hallucination execute asynchronously and surface low-performing prompts from traces. Such edge cases can then go through a human-in-the-loop verification, agent adjustment and ultimately enriches the validation data set resulting in a continuous loop of improvement.
There is no new platform to clear. Every standalone evaluation platform holds a copy of your prompts, your responses, and often your retrieved documents. That copy needs its own security review, its own data processing agreement, and its own access recertification. For an organization already running on Databricks, evaluation is a capability of a platform that has been through all of that.
The engine is open. MLflow is Apache-2.0 licensed and runs outside Databricks. MLflow also executes DeepEval, RAGAS and Phoenix judges through the same interface as its own and lets you choose which model powers a judge. Adopting it means neither abandoning metrics a team already trusts nor accepting one vendor’s idea of a grader.
Judging the Route, Not Only the Answer
MLflow records each agent run step by step, down to the individual model calls, retrievals and tool invocations. Evaluation can therefore examine how the agent reached its answer, scoring whether the right tools were called with the right arguments and whether the sequence was efficient.
This is where the failures that output scoring misses become visible: the agent that quietly queried the wrong source, the one that looped on an ambiguous result, the one that reached a correct conclusion by a path nobody would have approved. It also improves the conversation with the business. Rather than debating whether an answer felt right, teams review what the agent did.
What This Means for the Operating Model
Agent evaluation is not a one-time activity. It’s an online feature. With Databricks Managed MLflow, production observability runs as background jobs. Live production metrics with custom LLM judge scoring for hallucination execute asynchronously and surface low-performing prompts from traces. Such edge cases can then go through a human-in-the-loop verification, agent adjustment and ultimately enriches the validation data set resulting in a continuous loop of improvement.