
When critical equipment begins to fail, maintenance teams need to understand what’s happening, why it’s happening, and what should be done about it. The trouble is that the information required to answer those questions is often spread across multiple systems.
A maintenance knowledge graph brings together asset relationships, telemetry, work orders, permits, and parts into a connected view of equipment health and maintenance activity. Combined with a natural language interface, operators can ask questions, investigate failures, and plan corrective action from a single environment rather than navigating multiple disconnected systems.
A Realistic Maintenance Scenario
To demonstrate these capabilities, we developed a maintenance knowledge graph demo for a nuclear energy power company. While the demo centers on a nuclear site, the same concepts apply across all asset-intensive industries.
Nuclear sites move a lot of water. Water systems support everything from condensate and cooling to normal plumbing, which makes pumps critically important. In this example, we follow a developing issue involving Pump 301 as a user works to diagnose and address a failure.
Finding the Bad Actors
Knowing where to begin an investigation is the often first challenge.
Rather than manually reviewing maintenance records and reliability reports, an operator can use the knowledge graph’s natural language interface and ask it to perform a bad actor analysis across a pump circuit.
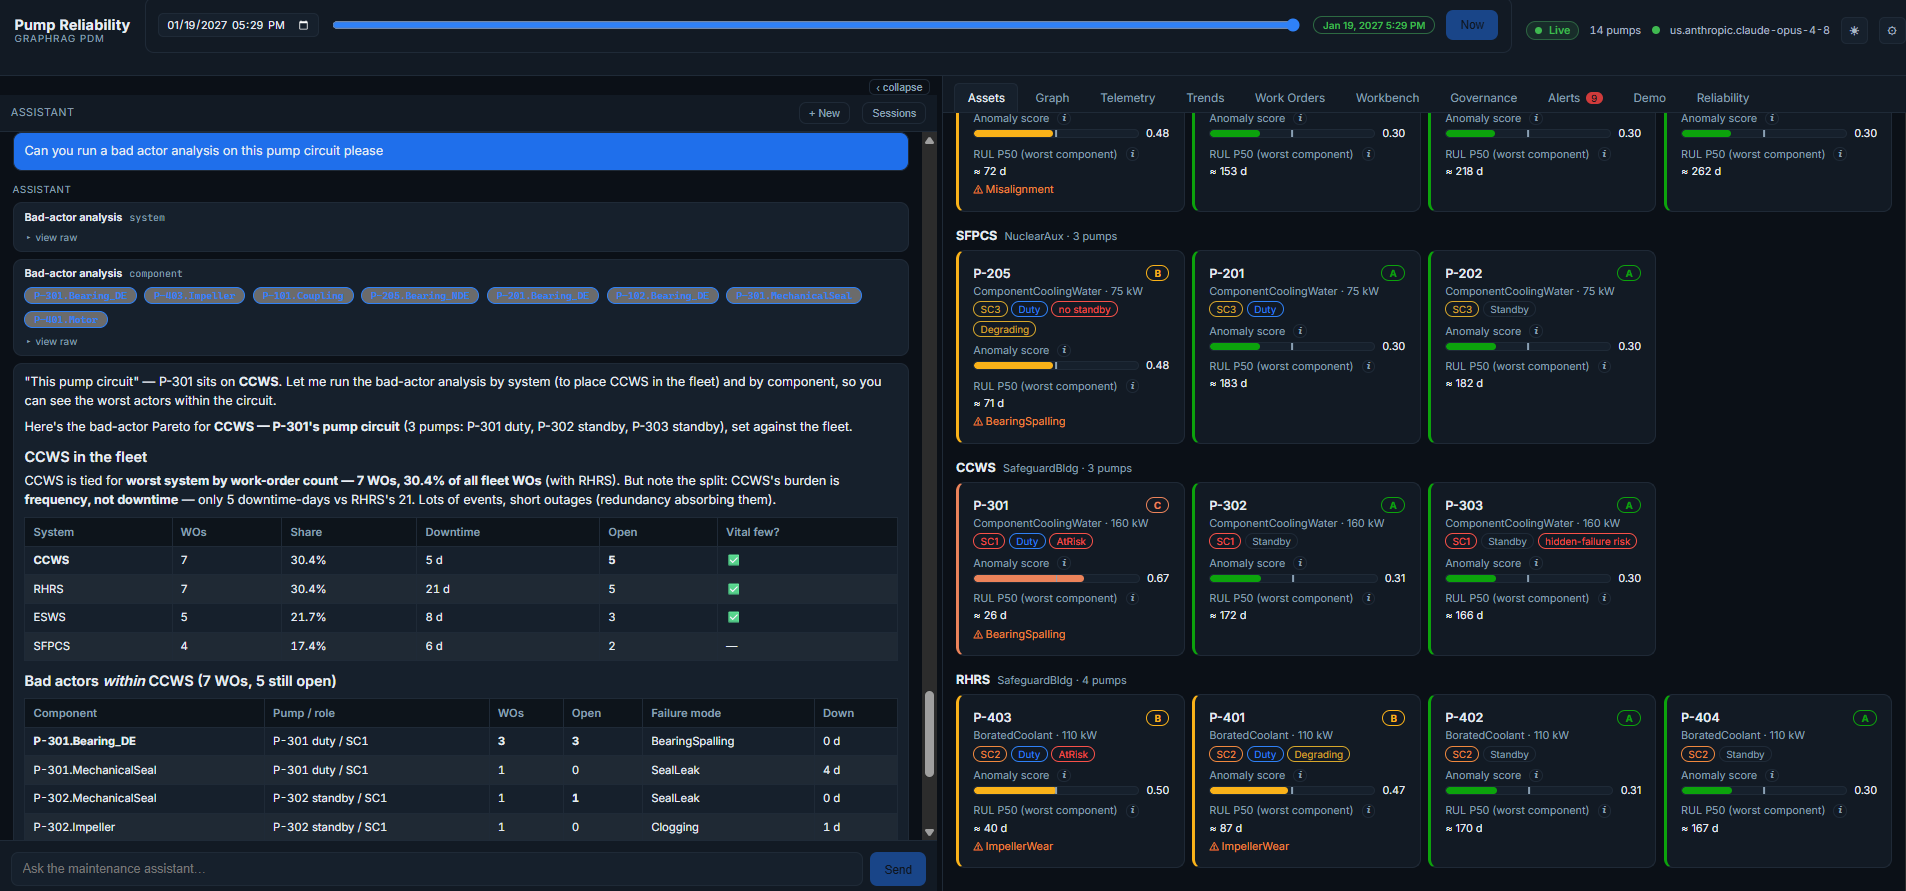
The analysis surfaces Pump 301 as the issue and highlights the components most closely associated with the problem, making it the logical starting point for further investigation.
A Maintenance Knowledge Graph Shows Relationships
Once Pump 301 has been identified, the next step is understanding how the issue connects to the broader maintenance environment.
The graph is, effectively, an asset map, and it shows relationships. Looking at an individual asset, users can see the asset broken down into components and assemblies. Those assemblies are then broken out into condition information and connected to related work orders, permits, and other maintenance information, like replacement parts.
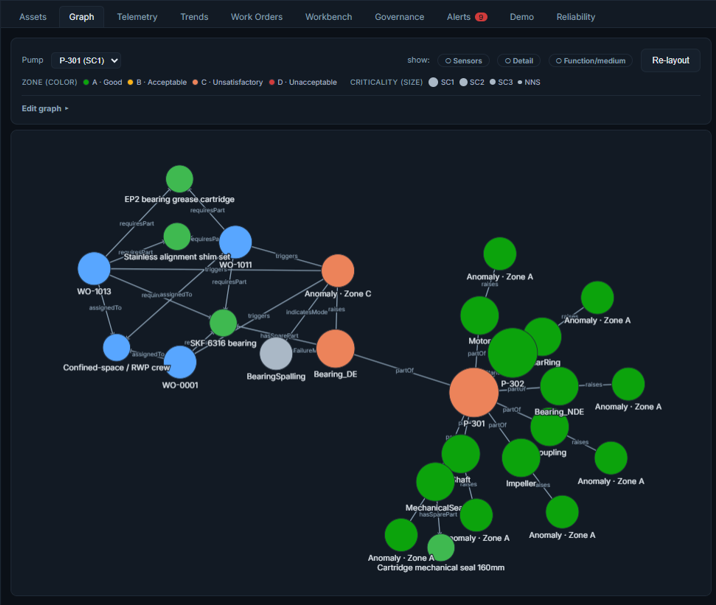
In this example, one of Pump 301’s main bearings is going out. Based on vibration, temperature, and other available telemetry, the graph is making its best guess at the condition causing the failure. In this case, spalling.
You can see which zone the pump is located in, along with the associated work order. That work order is tied to a replacement part. The system also shows the confined space permit required to perform the work.
That is what a graph can do for you.
Once You Have the Graph and the Telemetry, What Can You Do?
The rest of the demo shows the power of what becomes possible once you have both the graph and the telemetry.
If we look at the telemetry for Pump 301, you can see the vibration spikes it’s suffering. An operator can use this information to see what’s going on.
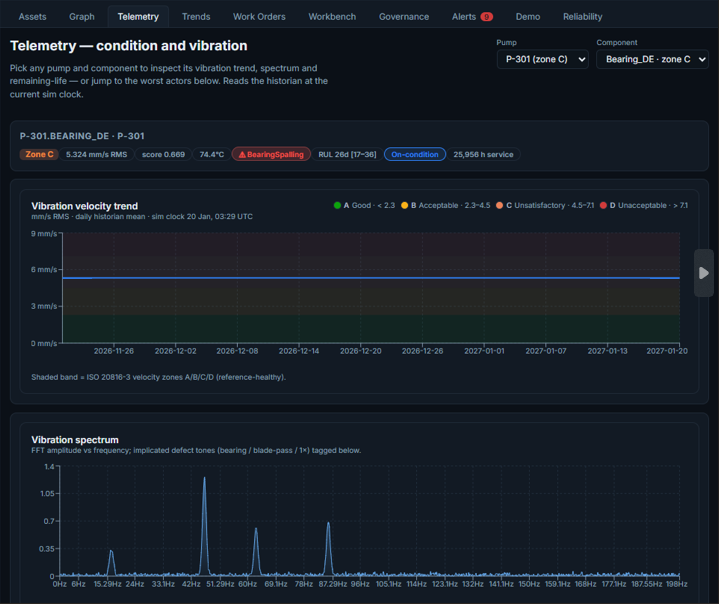
There is also a time-travel capability, which is critically important for operators. When a bearing starts to fail, one of the first questions is: When did it start going?
To answer this question, operators can drag a slider back to previous points in time to examine vibration trends and spikes at that moment.
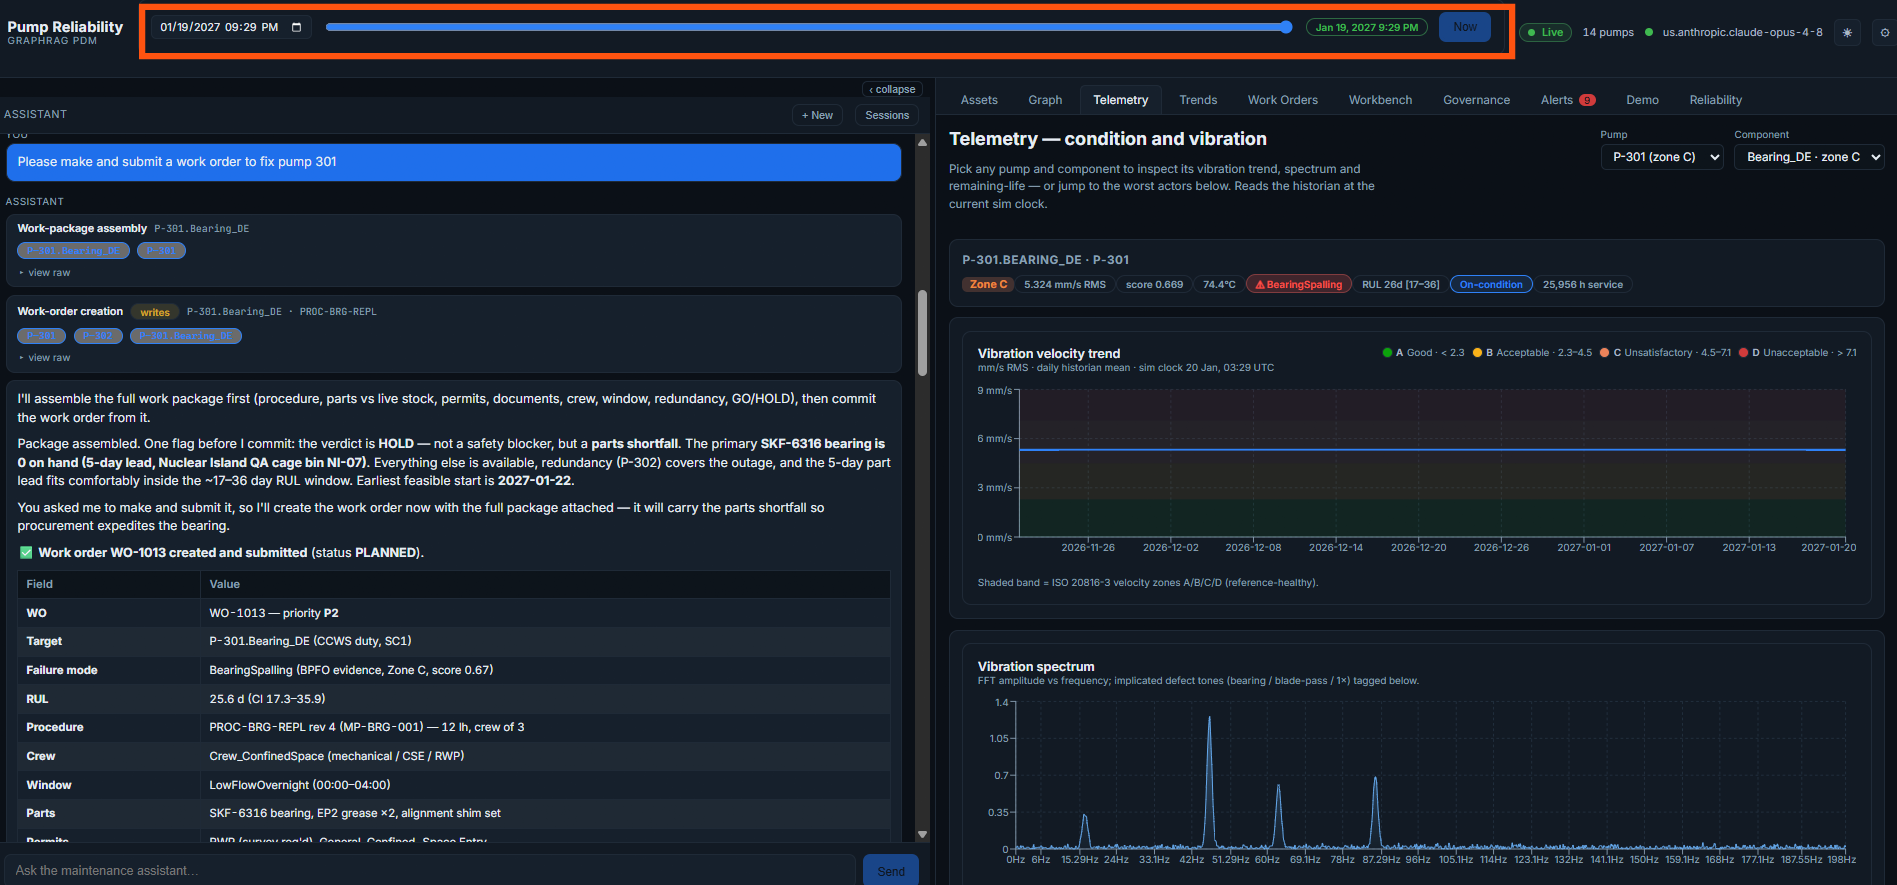
You can do this across all of the telemetry associated with the asset and its components, making it easier to see where trends developed and where spikes began to appear.
Drafting the Work Order
Diagnosing equipment problems is only part of the process. After the operator has looked at the asset and telemetry and determined there is an issue, the next step is initiating maintenance work.
In the natural language interface, the operator asks the system to create and submit a work order to address the issue affecting Pump 301. The system will then generate a work order that can be handed off to planning. The draft includes the information an operator would normally provide and identifies items such as:
- Required permits
- Required replacement parts
- Relevant equipment conditions
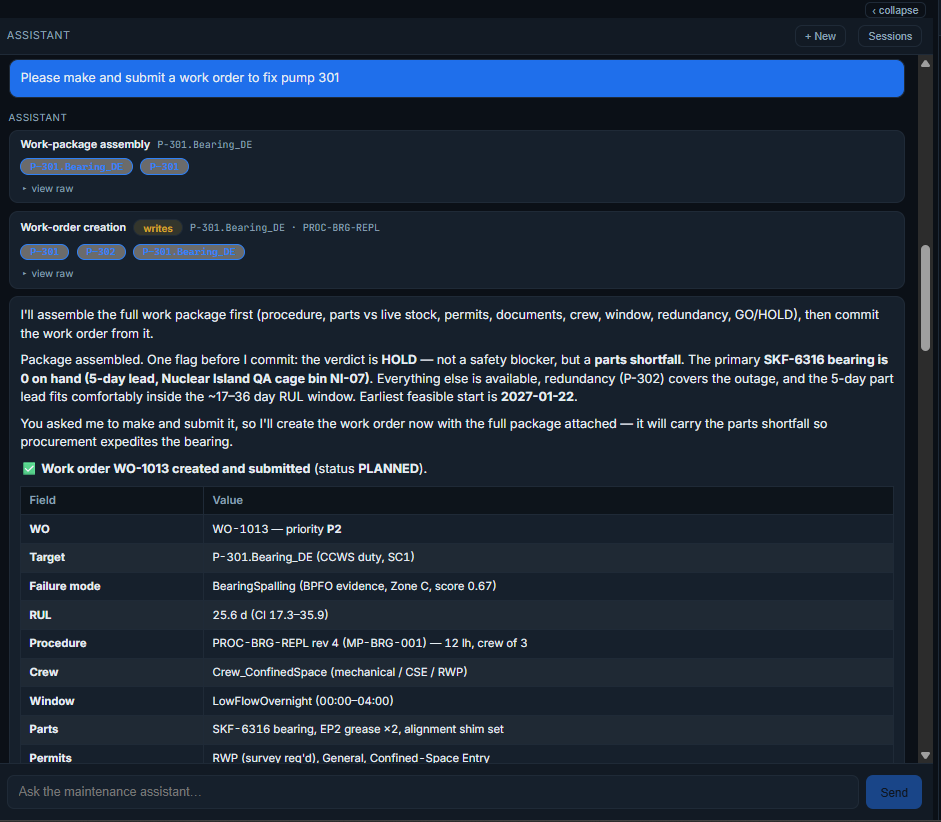
Planning can then review inventory, confirm resources, and move the work into scheduling.
The result is a faster transition from diagnosis to action.
Bringing It All Together
Throughout this example, the maintenance knowledge graph connected information that would traditionally be spread across multiple systems.
Operators could understand relationships between assets and components, identify recurring issues, review telemetry, examine how conditions developed over time, and generate a work order from a single environment.
This is what it means to radically condense the amount of time required to diagnose a failure.
By bringing together the graph, telemetry, and natural language interaction, operators can spend less time gathering information and more time taking action. Tasks such as preparing a work order, which normally takes 15 to 20 minutes, can be completed in seconds.
See What Else a Knowledge Graph Can Do
The maintenance scenario in this article is just one example of what’s possible when operational data, maintenance history, and asset relationships are connected.
Explore how knowledge graphs help organizations preserve expertise, improve decision-making, and make critical information easier to access in our related article, “Retirements Are Inevitable. Knowledge Loss Doesn’t Have to Be.“
And if you’d like to learn more about the maintenance knowledge graph demo featured here, connect with Perficient’s Energy & Utilities experts.